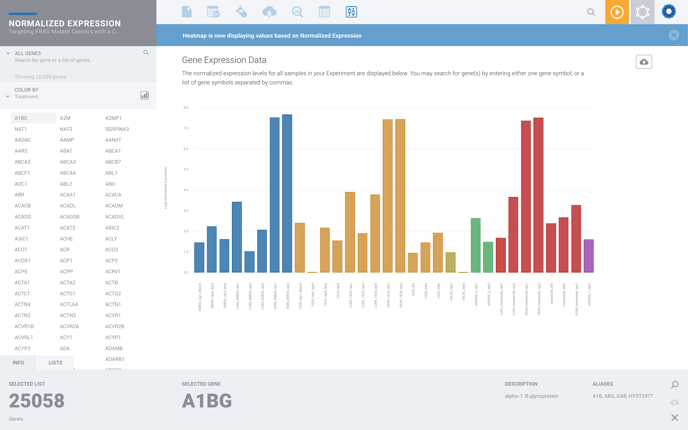
All ROSALIND analyses come with a view of your Normalized Expression, simply select your desired target from the list on the left hand side of your screen to see the levels of expression across all samples.
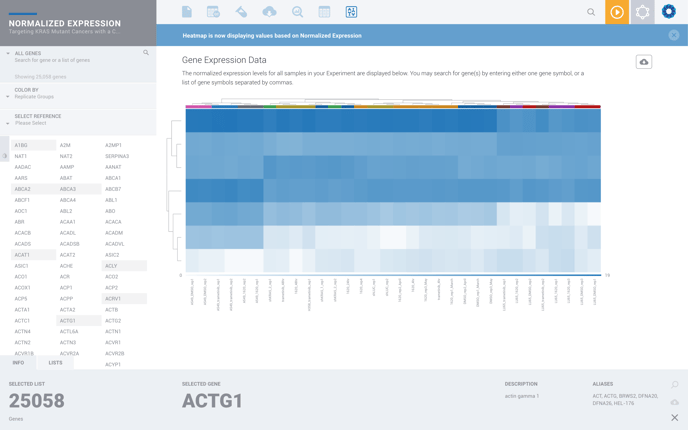
You many also choose multiple targets to view their expression levels in a custom heatmap by holding down to control key (for PC) or the command key (for Mac) and then selecting your desired targets. Hold Contol or Command + A to see the levels of expression for all targets.
Navigation
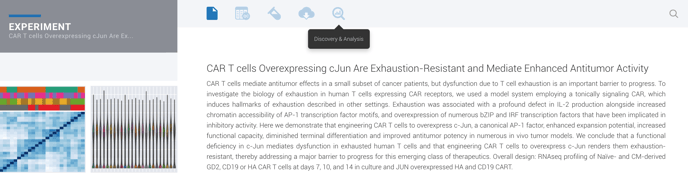
To access your Normalized Expression, select the "Discovery & Analysis" tab from the Menu at the top of any Experiment.
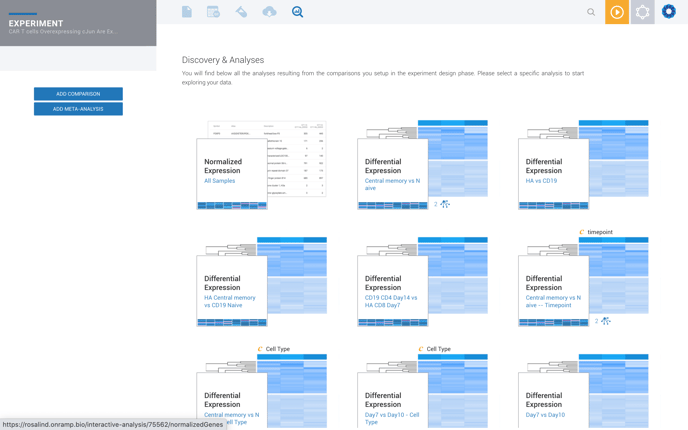
Then select "Normalized Expression" from your list of comparisons.
Gene Lists
To see the expression levels of a certain set of genes, you may create a gene list. Find instructions on how to create and import a gene list into your normalized expression here.