Downloading Nanostring Gene Set Analysis Significance Scores:
Navigate to the Differential Expression of your desired Comparison for a Differential Analysis. After selecting the NanoString Annotation pathway option, click the magnifying glass in the upper-right corner:
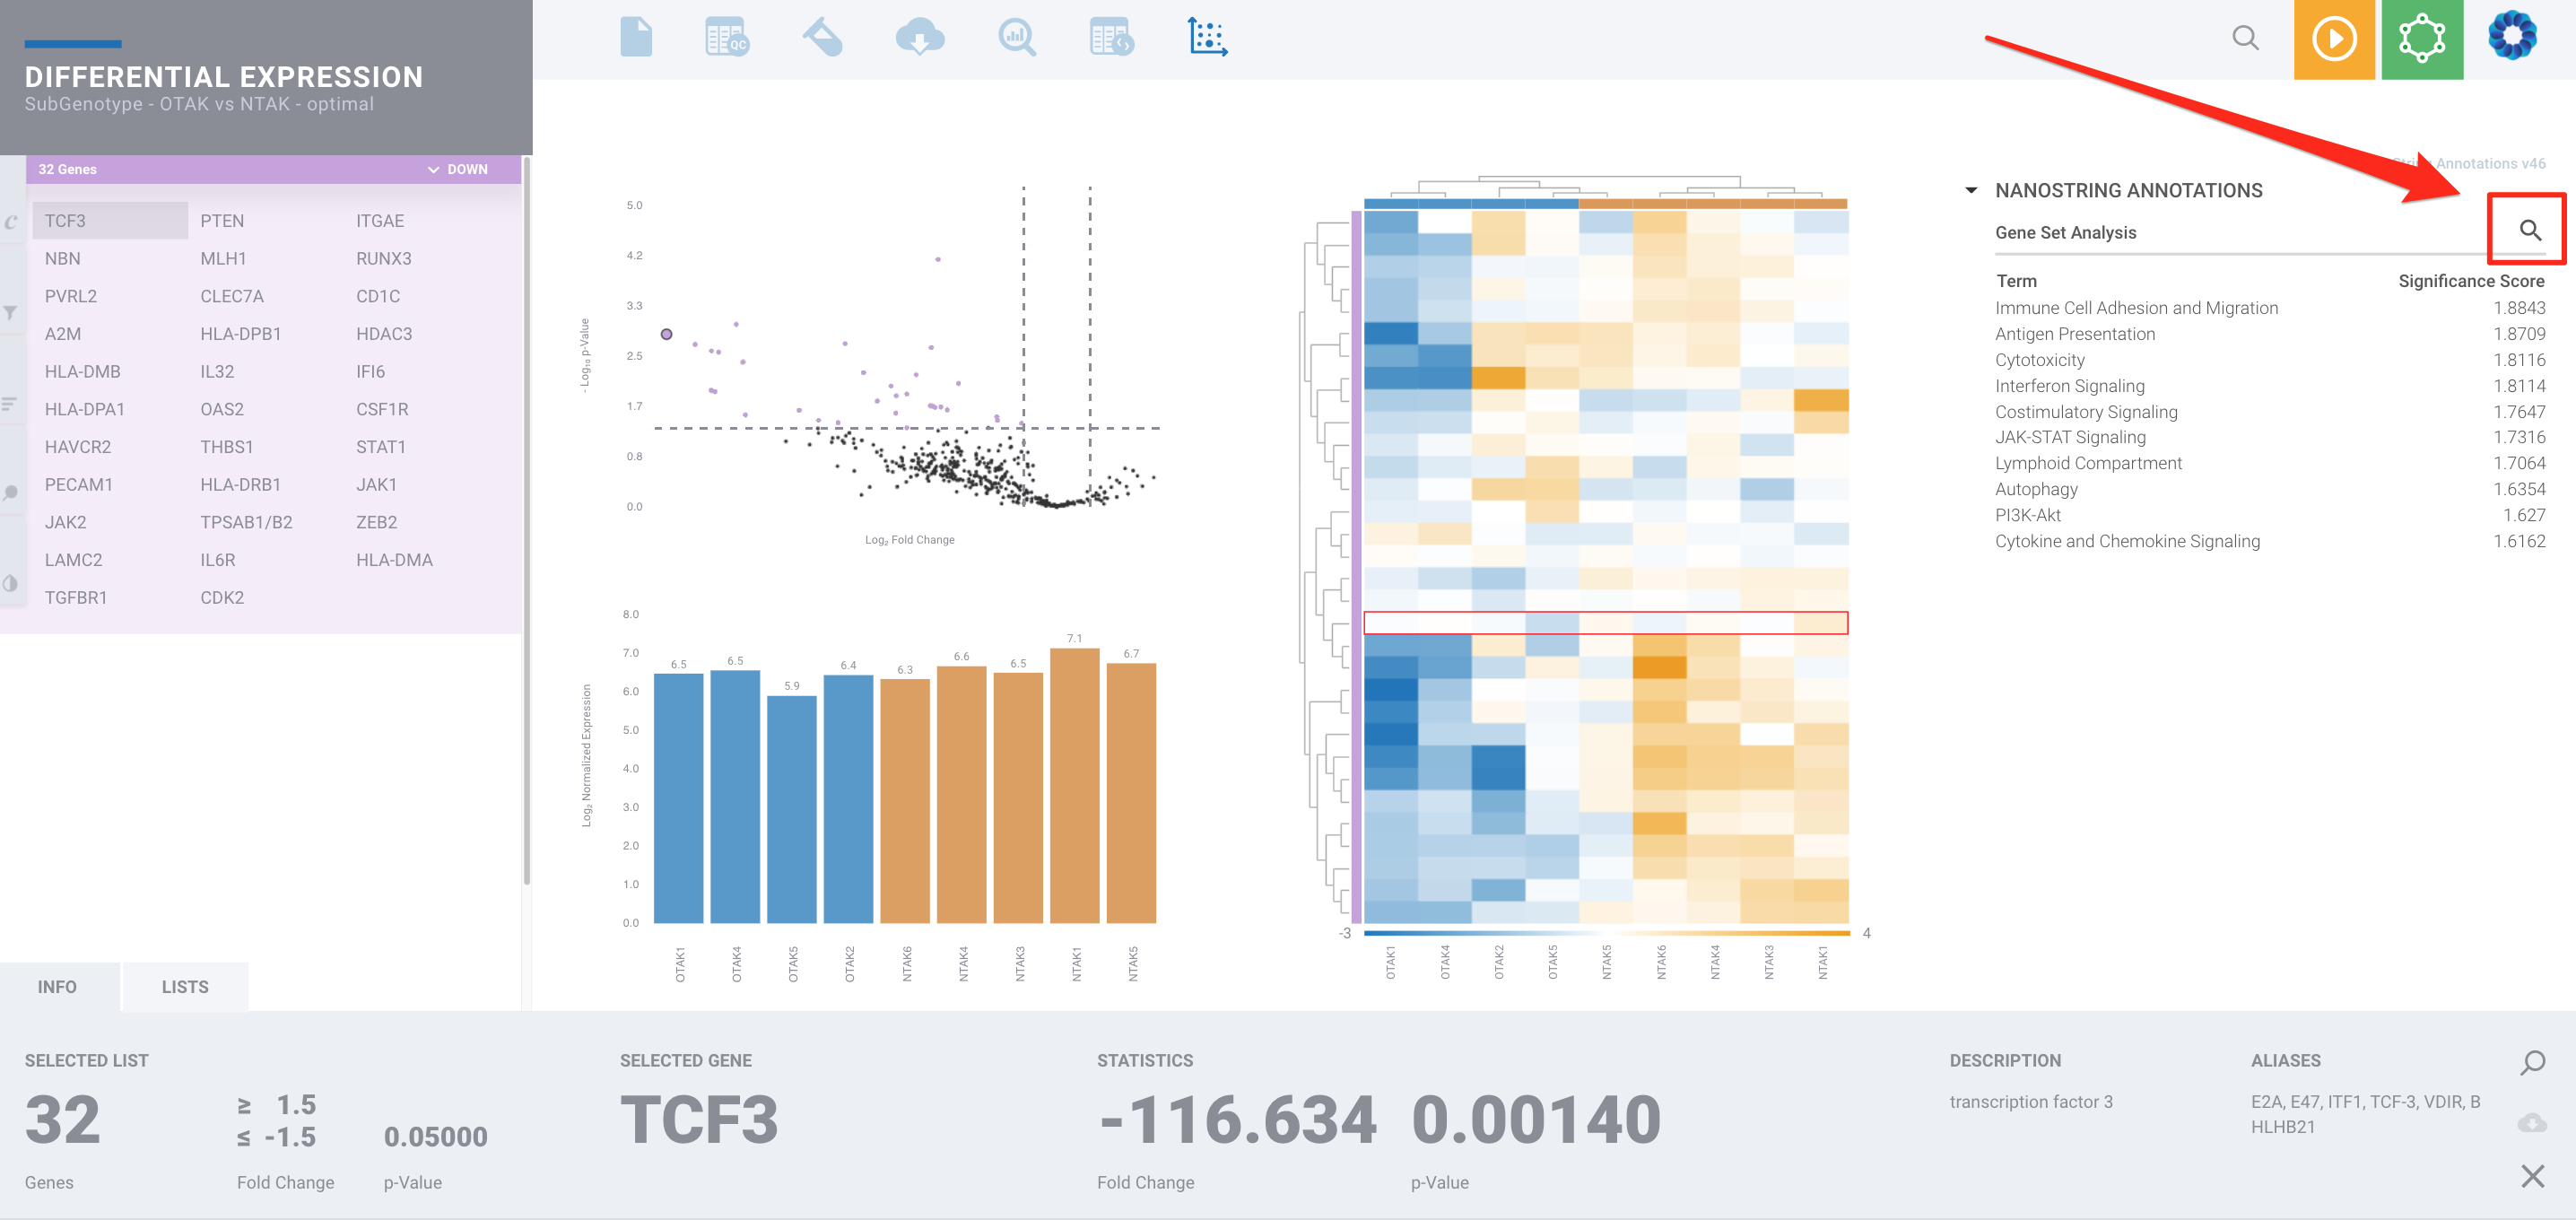
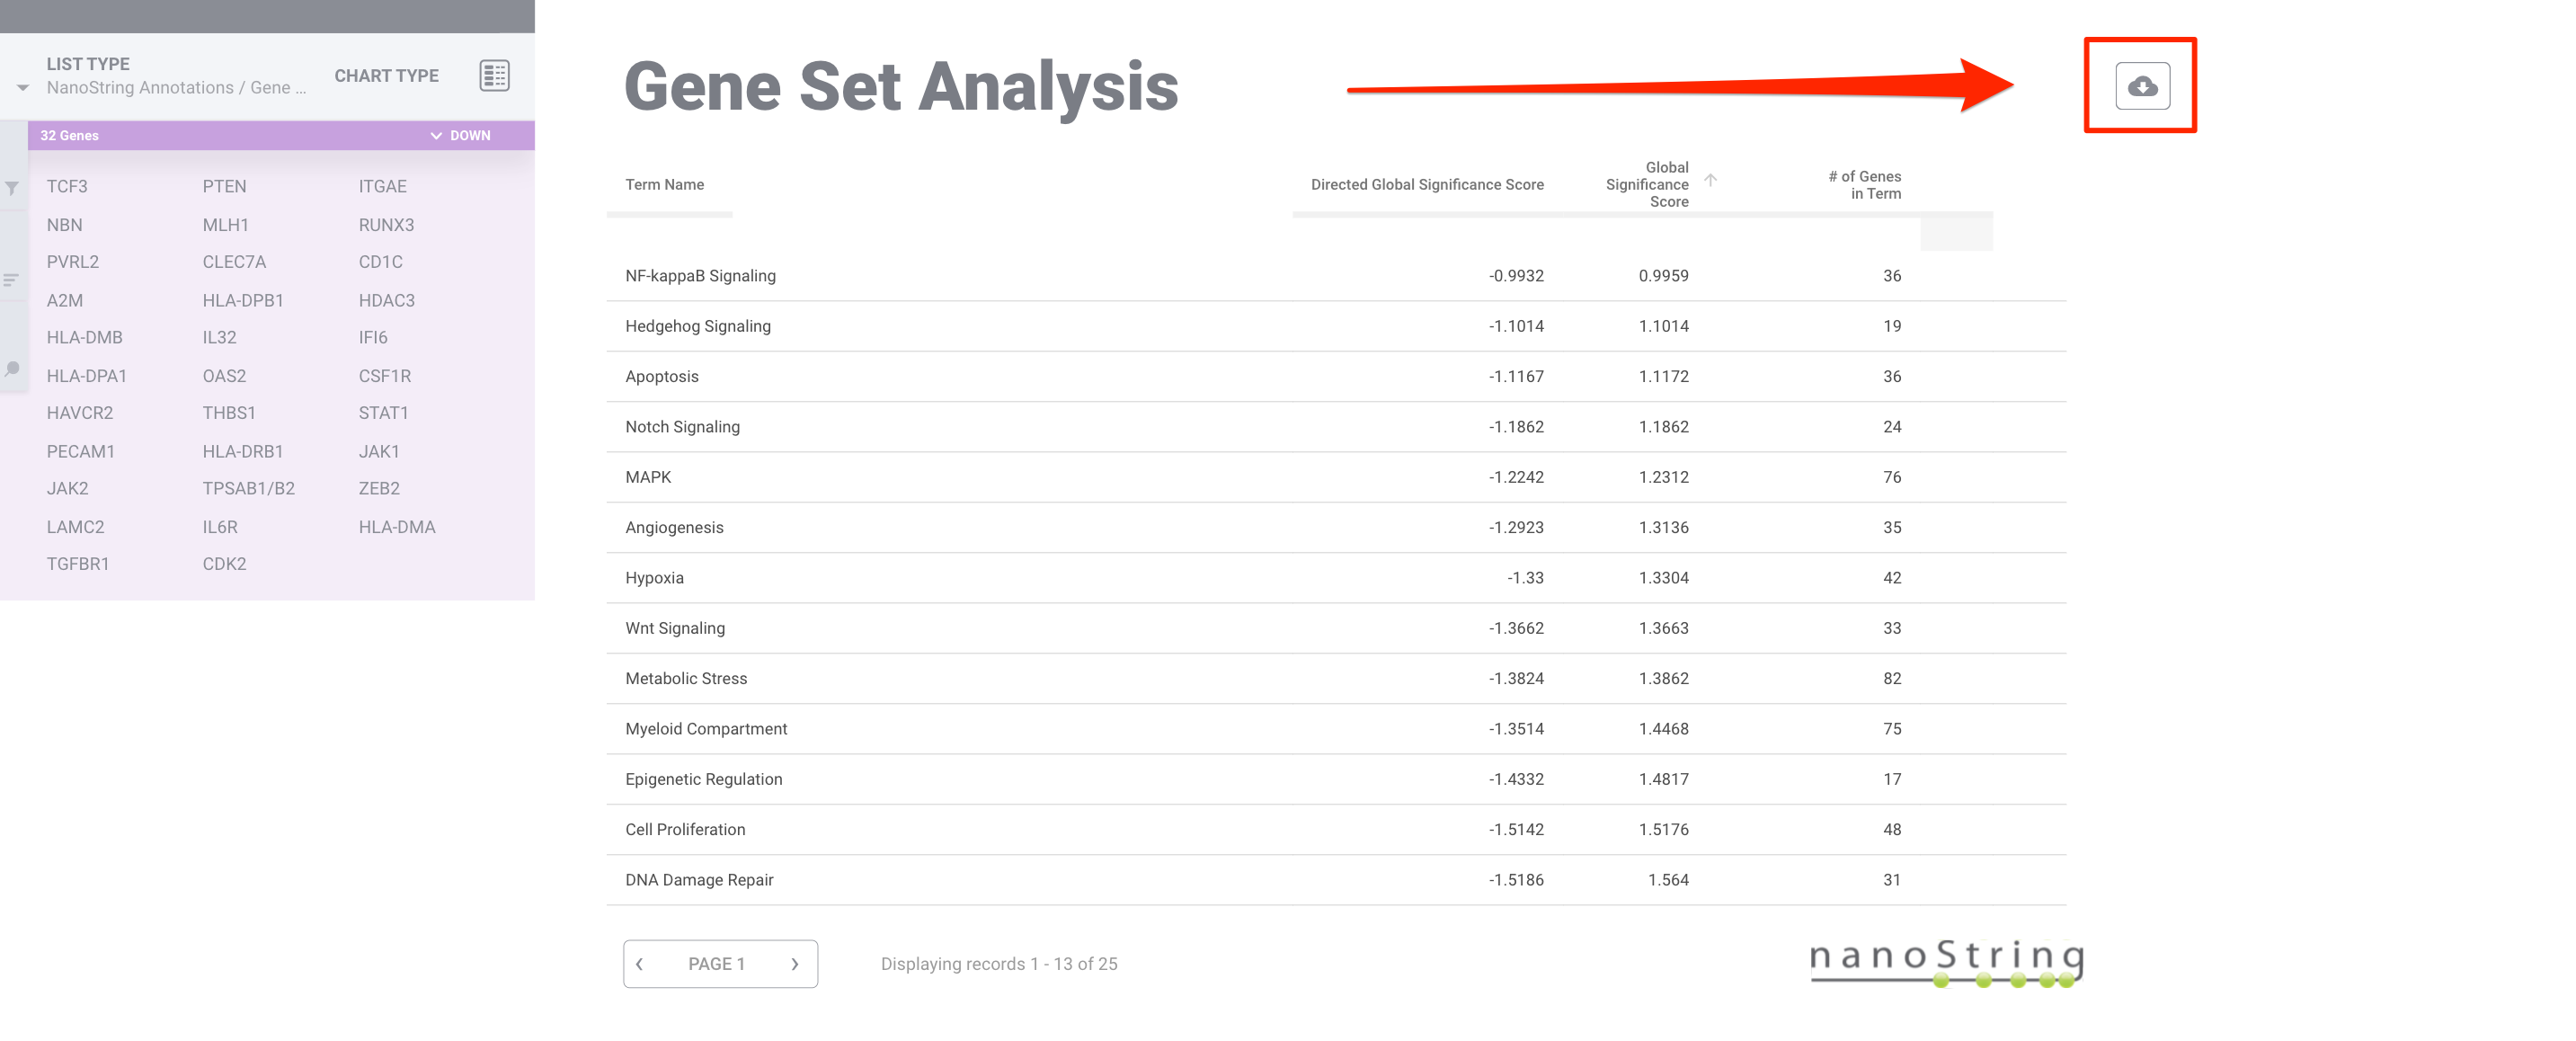
This will take you to the Gene Set Analysis page, where you can further explore the genes that pass your selected filter within each term and view if they are up or downregulated in the differential expression analysis for your comparison.
Click the cloud icon in the upper right corner. This will provide a .CSV file summary with the Directed and Undirected Global Significance Scores for each pathway and a .PNG file of the genes that pass the filter within that pathway.
If you click on a term, but do not see any genes appear on the left, this means that the genes used to calculate that score did not pass the current filter selected. For more information on how to adjust the selected filter, please see here
What are Gene Set Analysis Significance Scores?
- Global Significance Scores (GSS) measures the overall significance of the changes within a pathway and will always be positive regardless of whether genes are up- or down-regulated. GSS summarizes the combined t-tests of differential expression of all the genes in a pathway for the covariate of interest. Some can be up regulated, and others can be down regulated, or they can all be down or all up, but if the “sum of significance” is the same in each instance then the global significance score will be the same. In other words, the global significance score measures whether gene expression within a pathway is changing, but doesn’t take into account whether those changes are consistent with the pathway itself being activated or repressed.
- Directed Global Significance Scores are more similar to Pathway Scores as they may have either negative or positive values (for down- and up-regulated pathways, respectively). Directed or undirected GSA Scores of greater magnitude will generally indicate a stronger pattern in the pathway level expression changes, and because these scores have been scaled to the same distribution (that of the t-statistic), they will be more robust to comparisons between different pathways or experiments. A high score indicates that a large proportion of the genes in a pathway are exhibiting changes in expression across groups of samples.