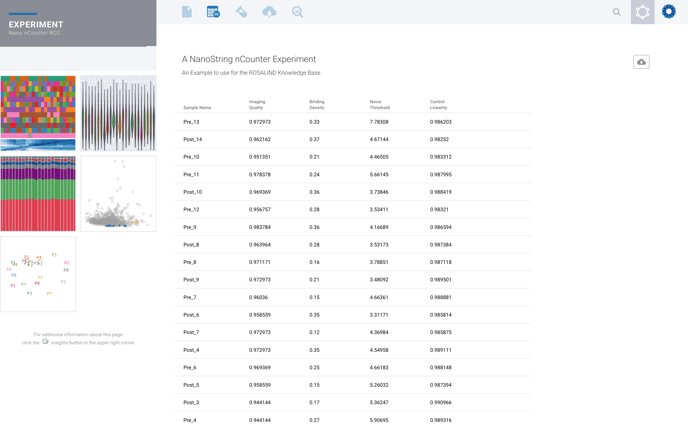
In addition to the sample correlation heatmap, control graphs, MDS plot, and violin plot to view the relation between the expression profiles in your samples, ROSALIND also provides multiple metrics to verify the quality of your data. Any issues detected in your samples will be automatically flagged and the issue detected will be displayed for easy interpretation of the QC metrics. For nCounter experiments, the following measures are reported:
- Imaging Quality: The percentage of fields of view (FOVs) captured.
- 0.75 or lower causes flag
- Binding Density: Concentration of barcodes seen by the instrument, in spots per square micron. For more information on interpreting Binding Density, please see this article here.
- <0.1 or > 2.25 causes flag
- Control Linearity: A correlation analysis in log2 space between the known concentrations of positive control target molecules added by NanoString and the resulting counts.
- < 0.95 causes flag
Noise Threshold versus Limit of Detection (LOD):
*Please note that these both have the same criterion, but as of July 2021 Rosalind has updated our Noise Threshold formatting to match nSolver's output for LOD, see below for more detail.- Noise Threshold (used for data run before July 2021)
- The limit of detection of the assay (minimum expression level detectable) by calculating how many standard deviations the 0.5fM Positive Control value is above the average Negative Control value.
- QC flag occurs if below 2
- Limit of Detection (used for data run after July 2021)
- We report the following:
- Average Negative Control value (“Mean”)
- Standard deviations of Negative Controls (“Std Dev”)
- 0.5fm Positive Control value (“Pos Control E”)
- QC flag occurs if “Mean” + 2 * “Std Dev” is greater than "Pos Control E"
In other words, the counts of POS_E should be higher than two times the standard deviation above the mean of the negative control. Samples that fail this test are flagged.
- QC flag occurs if “Mean” + 2 * “Std Dev” is greater than "Pos Control E"
- We report the following:
-
-
-
- High expressed HK genes
- for HK, it flags samples where fewer than 75% of genes have at least 50 counts
- for more information on the flag 'Low percentage of housekeeping genes over 50' please see here
- High expressed HK genes
-
-
- Ligation Control Threshold*: This metric measures the relationship between the expression of the positive and negative ligation controls of the assay by calculating how many standard deviations the positive ligation controls are above the average negative ligation controls.
- *for miRNA nCounter datasets only
Example of Noise Thresholds (prior to July 2021)
Example of LOD (after July 2021)
.png?width=688&name=Screenshot%20(69).png)