Default Option:
For experiments launched from raw data (RCC files) with the ‘Default’ option selected, ROSALIND implements the default method established by the NanoString Biostatistics Team (and implemented in nSolver Advanced Analysis) to remove genes/probes from differential expression analysis if they are expressed near or at background levels. This removal of low expressors does not happen for experiments launched from import of normalized counts. A background threshold, also called the Limit of Detection (LOD), is calculated independently for each sample as the arithmetic mean of the negative controls plus 2 standard deviations. Probes (genes) are removed from the analysis if their raw counts are less than the background threshold in more than 85%* of samples in the experiment.
*Note: prior to February 6, 2024 probes (genes) were removed from the analysis if their raw counts were less than the background threshold in more than 50% of samples in the experiment.
Advanced Option:
Custom removal of low expression probes is available through the Advanced option, which is only enabled for certain subscription types. Probes are removed from the analysis if their raw counts are less than the low count threshold and greater than the specified frequency of samples. The probes recommended for removal according to default settings are highlighted in red. The low count threshold default, also called the limit of detection (LOD), is calculated independently for each sample as the arithmetic mean of the negative controls plus two standard deviations. Adjusting the Low Count Threshold to a custom value will override the sample-specific defaults and apply the same custom threshold to all samples. The default Sample Frequency threshold is 85%. The sliders can be used in combination to customize which low count probes are removed from the analysis. The "Reset To Recommended Probes" button reverts the probe selection to defaults, and the "Export Raw Data" button initiates download of the raw data for further exploration.
Viewing pruned probes:
For experiments completed prior to February 6, 2024:
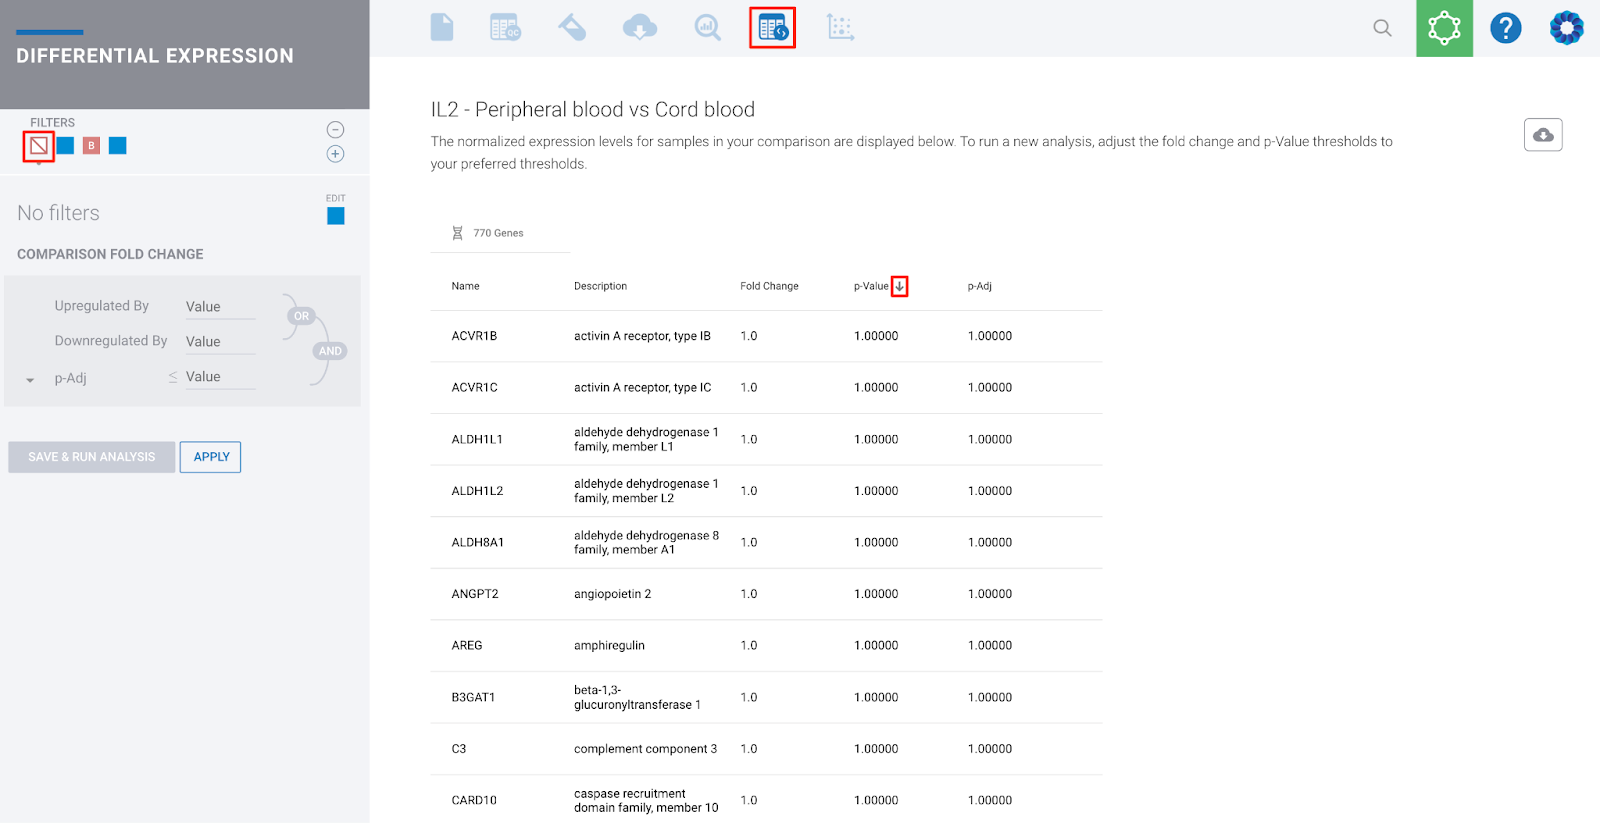
Probes that have been pruned are reported in the Filter Table or Downloaded Comparison Table as having a p-value, adjusted p-value, and linear fold-change exactly equal to 1 (or a log2 fold-change value exactly equal to 0). Please see the screenshots below for further reference on where to navigate and view the pruned probes.
Open the Filter Table within each differential expression comparison. Select the ‘no filter’ option and sort by fold change, p-value, or p-adj, or click the download icon in upper right corner (grey cloud with an arrow) to export the data:
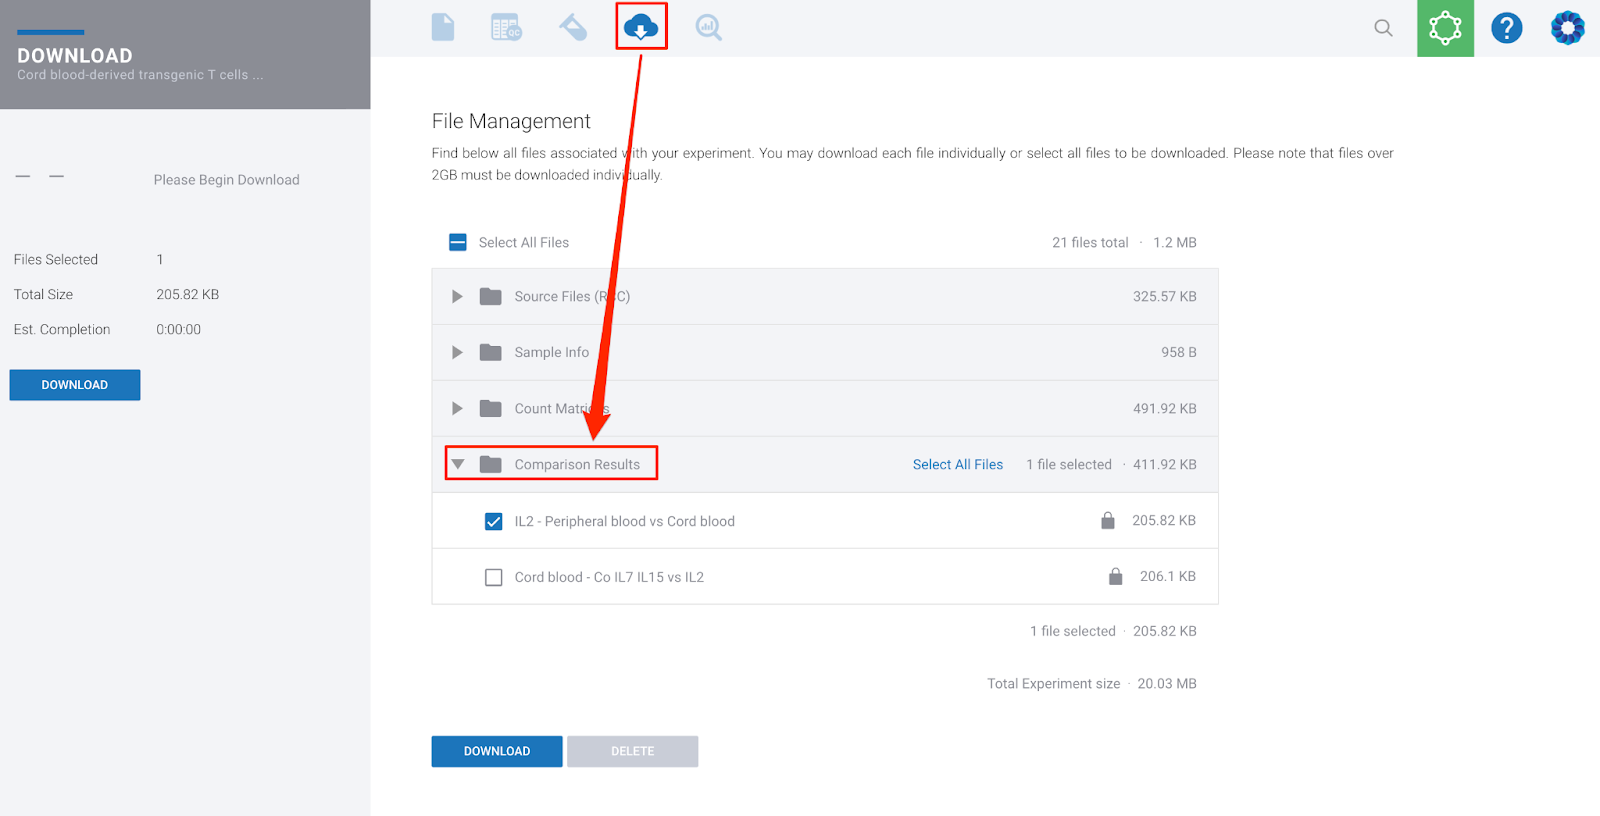
Alternatively, open the Comparison Results folder within the File Management tab of the experiment to export the data: