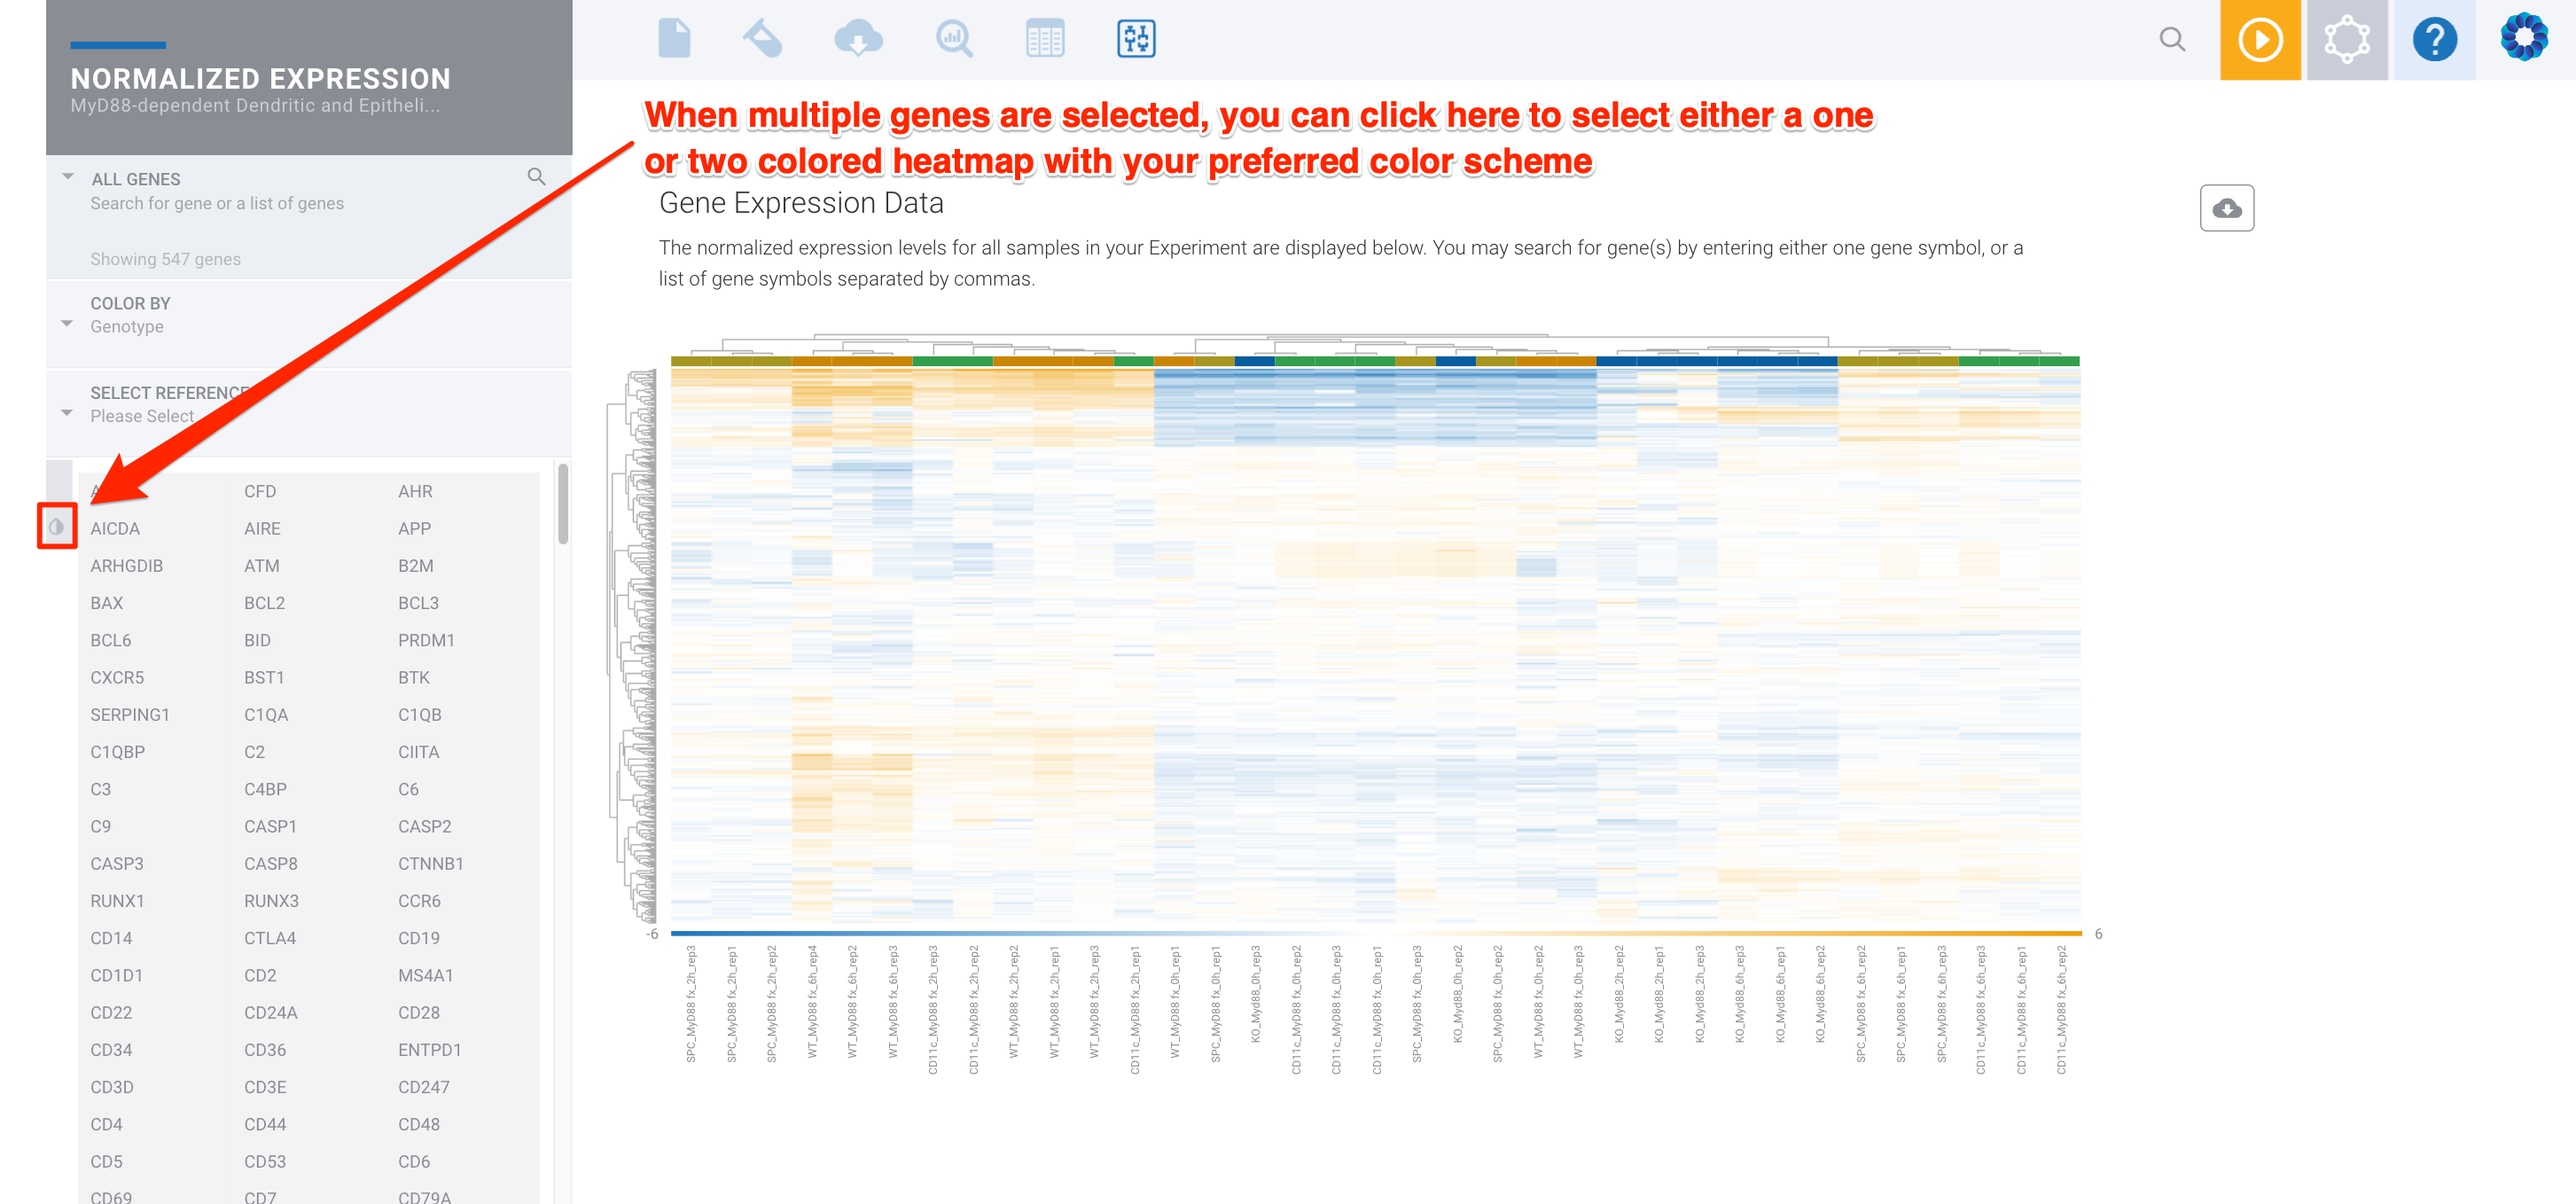
Switching the color scale will adjust the values you are seeing so that they take advantage of the one or two color scale methods. To do this, select the little grey and white color droplet on the left menu. When you switch the color scale, you will see a blue message bar appear at the top of the page to inform you which values are being displayed in the current heatmap view.
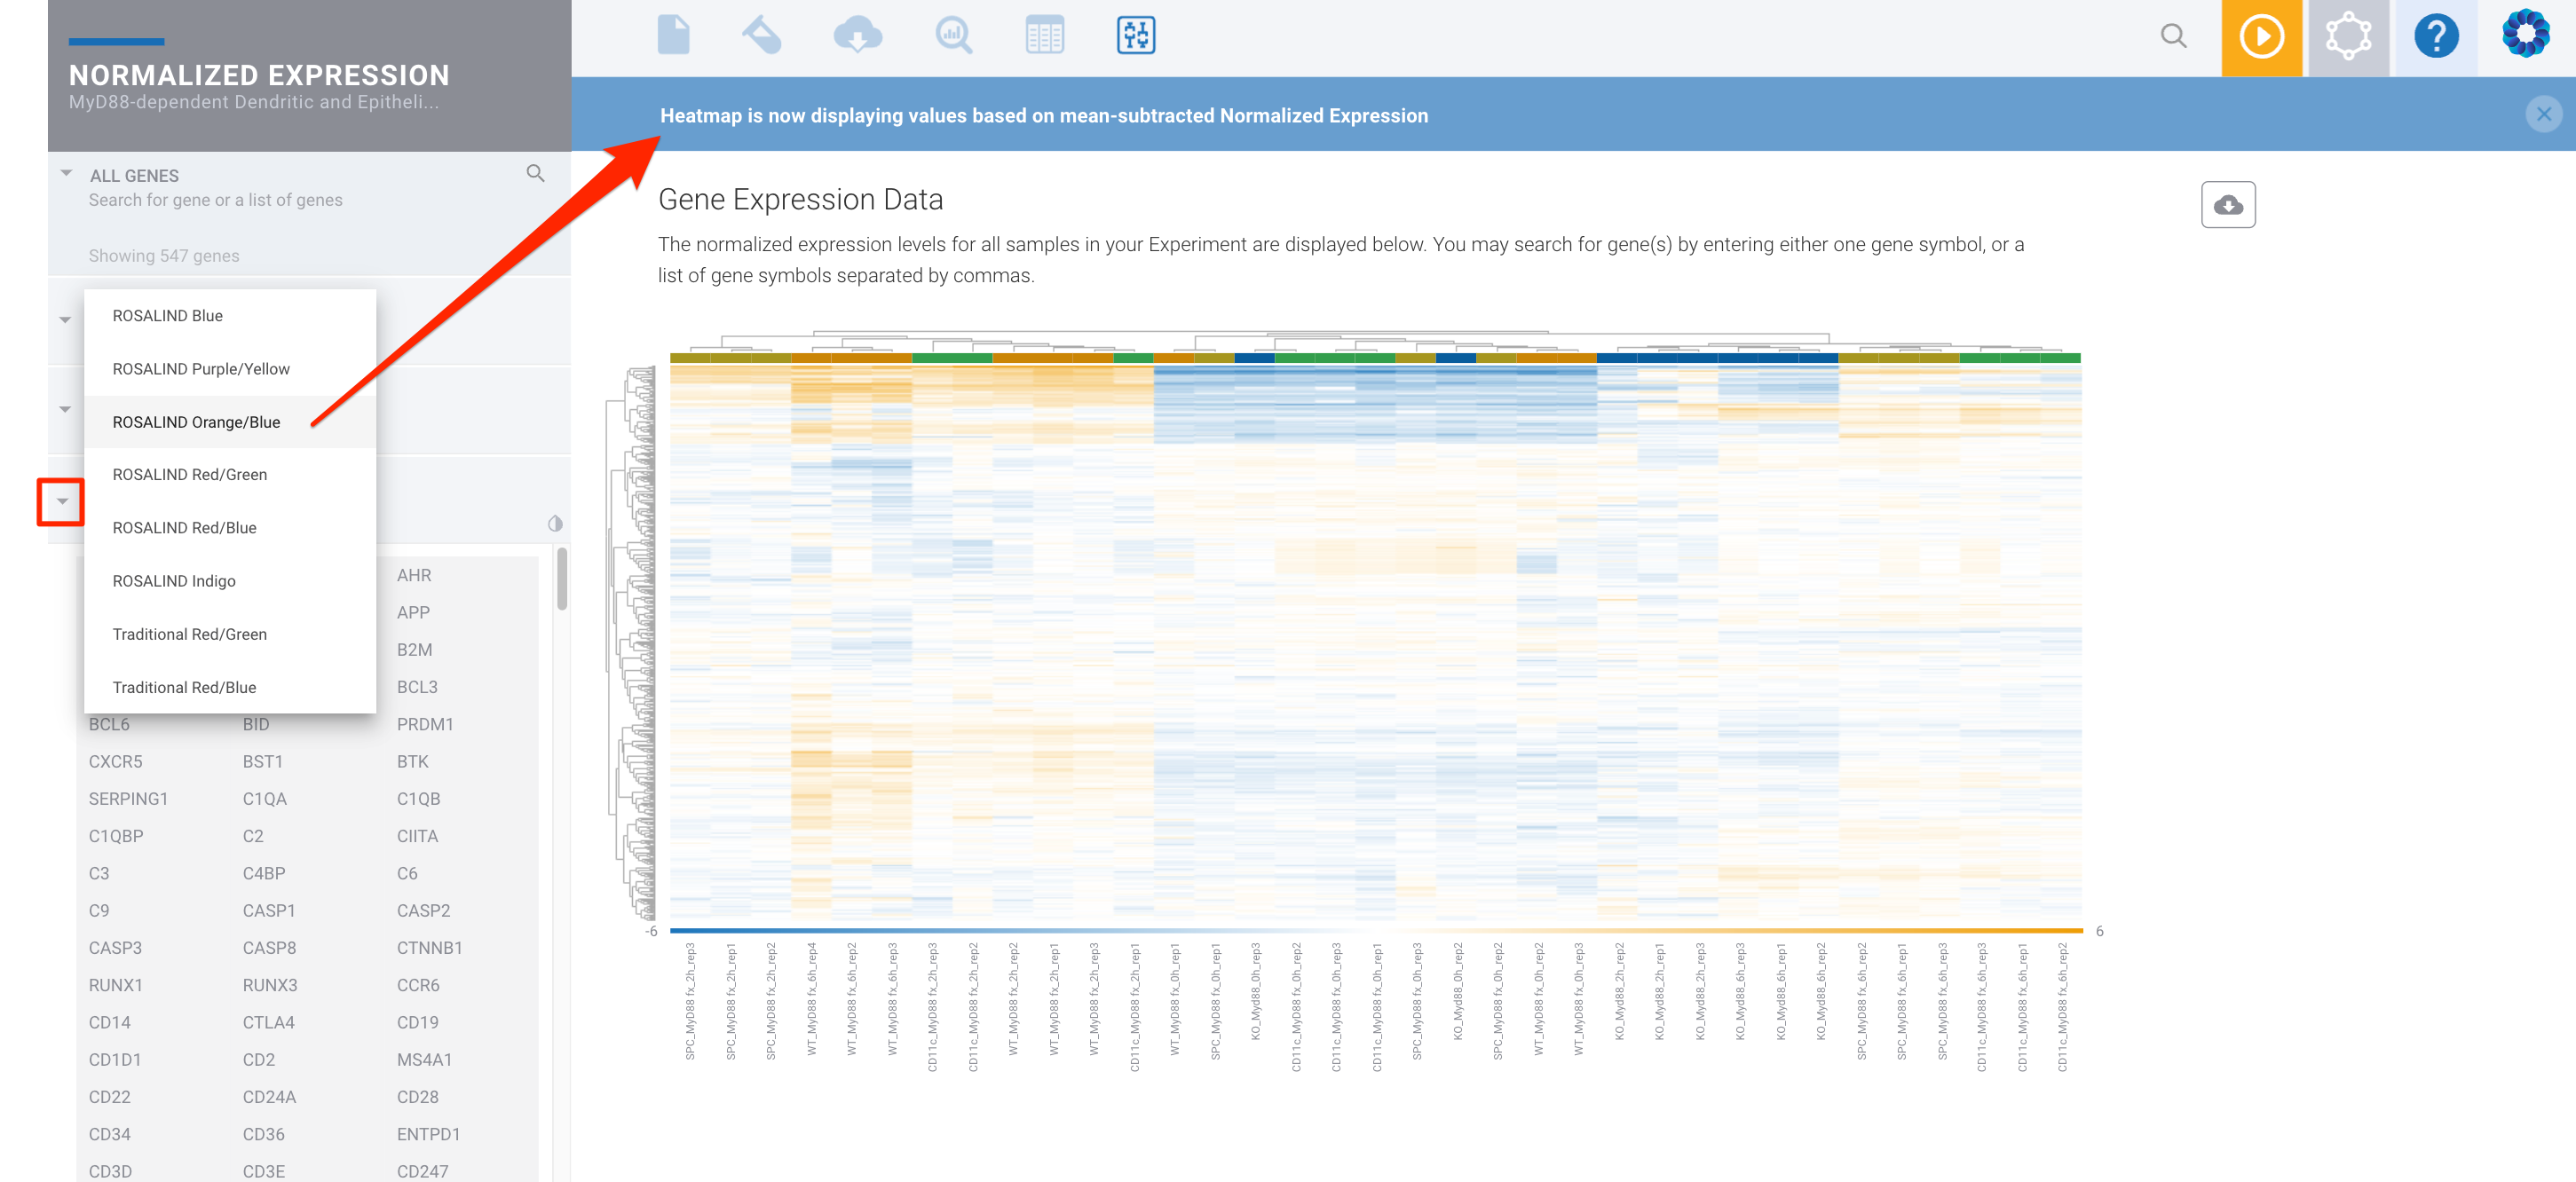
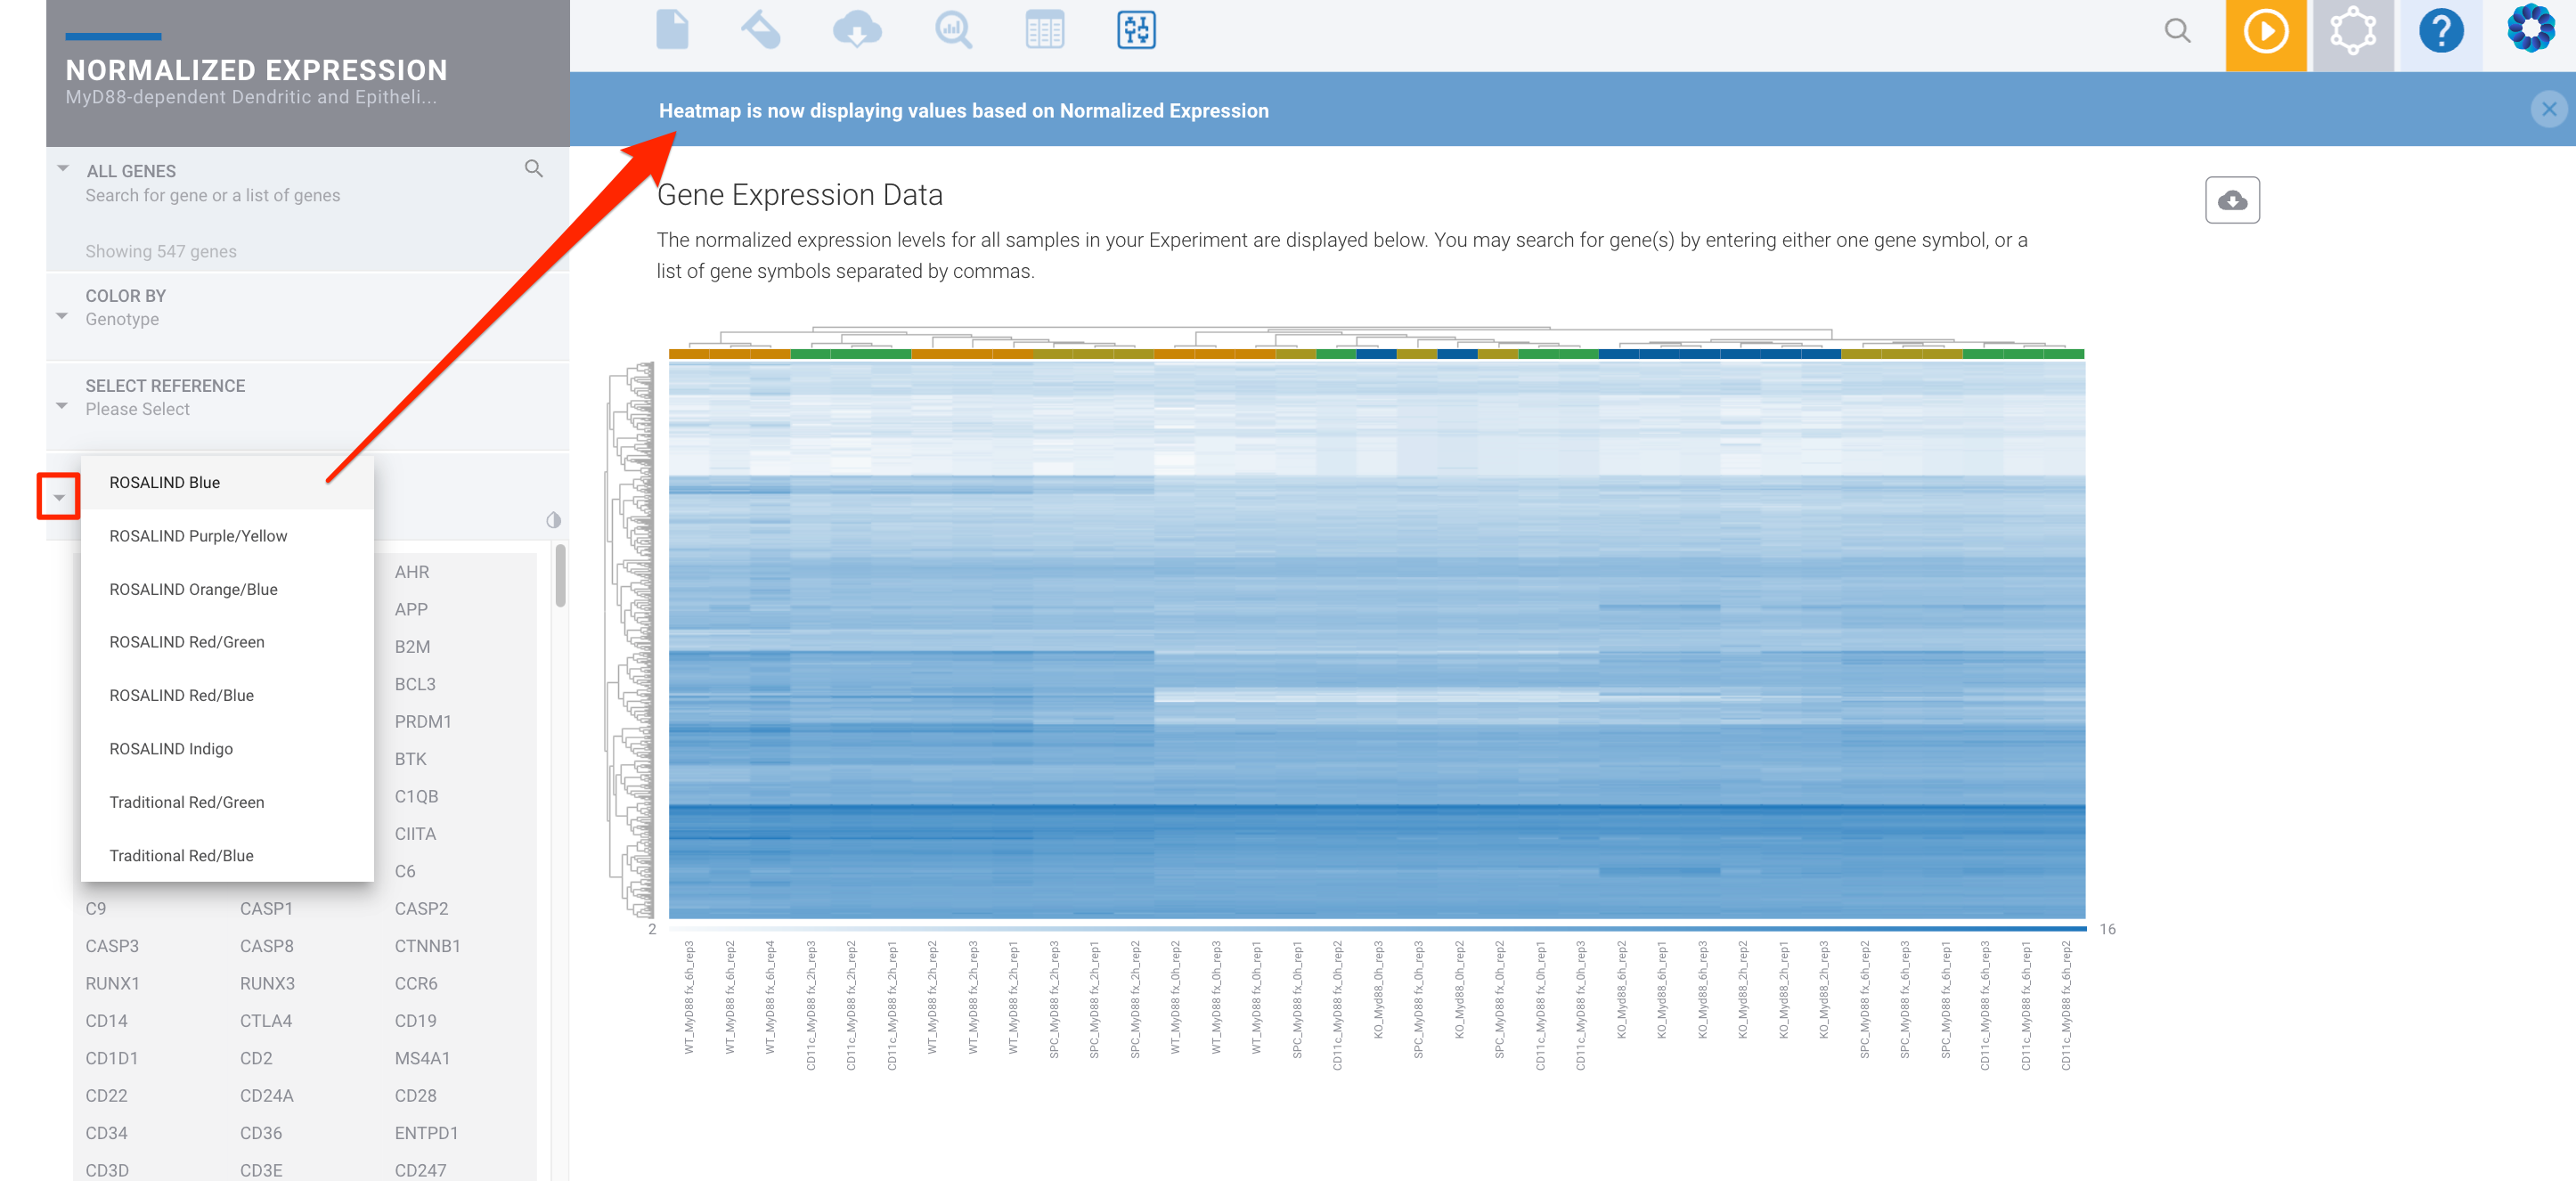
The single color heatmaps (for example 'ROSALIND Blue', which is on a white to blue scale) color the heatmap based on the log2 normalized expression values. The two color heatmaps (for example ROSALIND Orange/Blue) color the heatmap using mean subtracted normalized log2 expression values. So for each gene the average of the log2 normalized expression is taken and subtracted from each sample's expression. Another way to say this is that the two color heatmaps represent log2-normalized gene expression after subtracting the mean on a per-gene basis.
To bring up the heatmap view on the Normalized Expression module, you can select all genes by pressing ctrl+A or select a specific subset by holding ctrl (Windows) or cmd (Mac) and then clicking multiple genes with your mouse. You could also click on the arrow next to ALL GENES to use a custom Gene List. Once in the heatmap view, you will be able to view and click the grey and white color droplet icon:
You can then select a two color heatmap:
Or a one color heatmap:
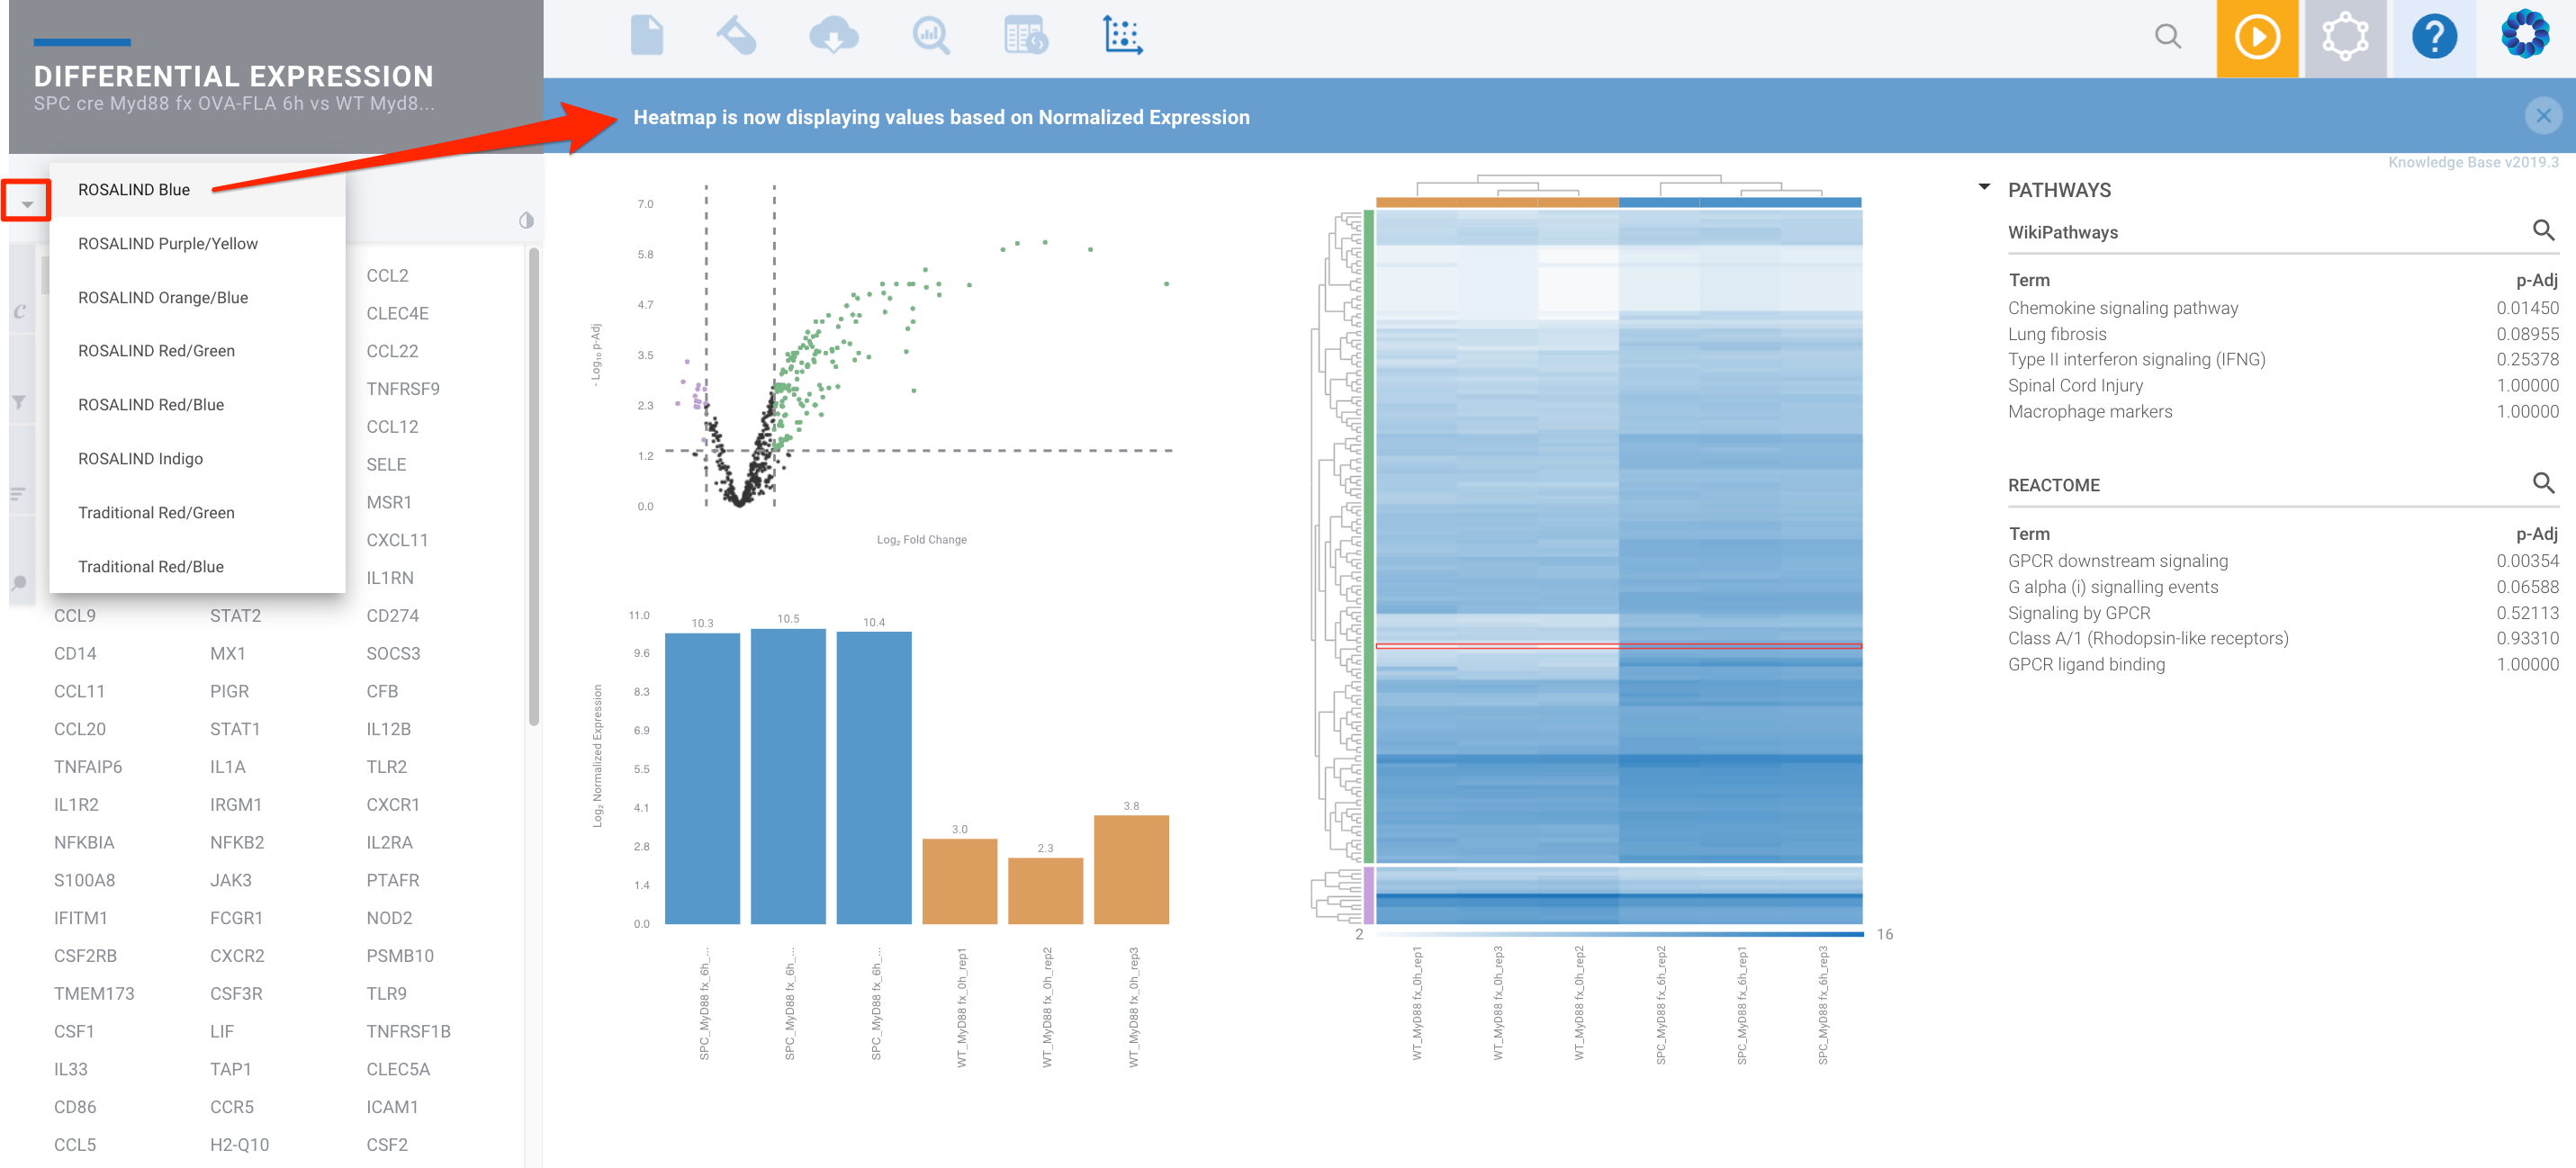
These options are also available within the Differential Expression module:
You can also customize the default heatmap color scheme to suit your preferences. To do this, open your User Profile menu in the upper right corner, then select Preferences & Settings. Scroll down to the Discovery & Analysis Defaults section, where you'll find the Heatmap Color Scheme option:
