For videos on creating, accessing, and interpreting Meta-Analyses, see the ROSALIND Academy Video Library Key Features Section: Meta Analysis Videos.
What is a Meta-Analysis?
A Meta-Analysis is a comparison of your comparisons. They can reveal patterns and insights across experiments. For each unique pattern, ROSALIND performs pathway analysis and reports the enrichment scores associated with each cluster. You can use Meta-Analyses to:
- Compare the differential gene expression of different treatments (each against their control group) together to see if the treatments all activate the same pathways.
- Compare your datasets with publicly available datasets.
- Compare the differential gene expression of a drug at various time points post-treatment.
- Compare datasets from two or more assay types in a multi-omic analysis
- Compare the gene expression of different cell lines in their response to a specific drug.
- Compare your gene expression data to your epigenetic data to see the effect of the gain/loss of the promoter region.
- Any other instance where you'd like to compare two or more pairwise comparisons, all comparisons are fair game!
Why is Meta-Analysis important?
You can compare similar datasets against the other or compare datasets from two or more assay types in a multi-omic analysis. In the Meta-Analysis below, we compare similar datasets to look at the gene expression between groups of Covid patients at various stages of disease progression.
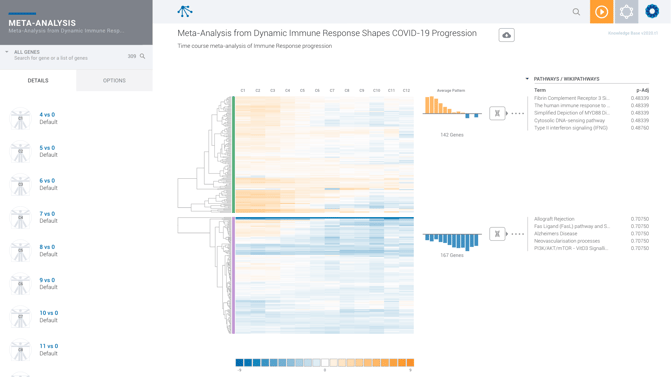
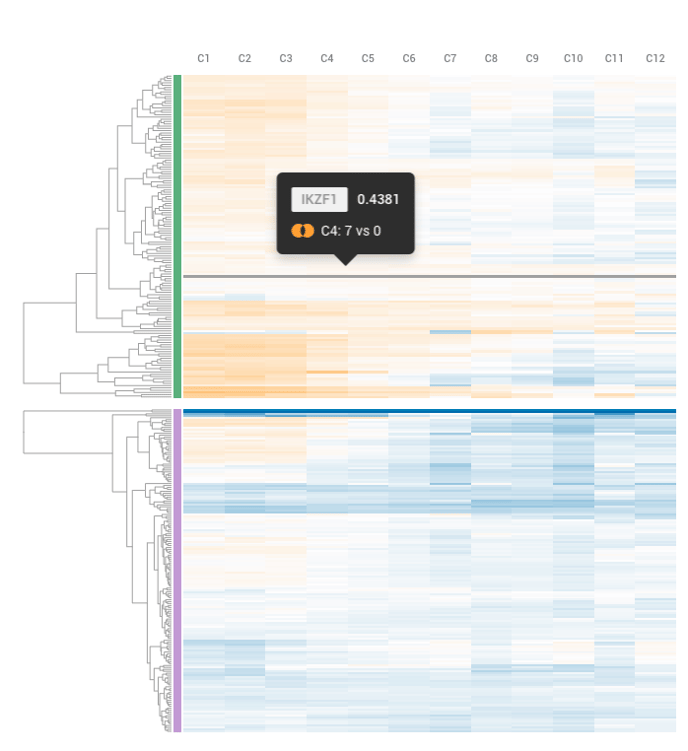
Each row on the heatmap refers to 1 comparison you've added to your Meta-Analysis. You can see which comparison by referencing the list of comparisons on the left hand side of your screen. Each line on the heatmap refers to a specific gene. When you hover over the heatmap with your mouse, you get a detailed look at the log fold change of that gene for that comparison, as well as the comparison we derived the gene expression from.
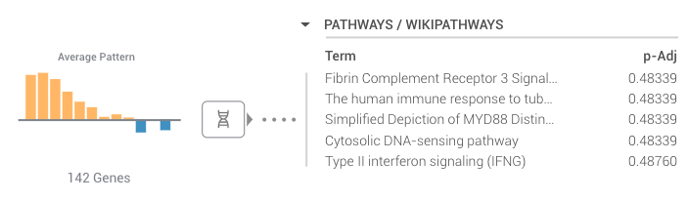
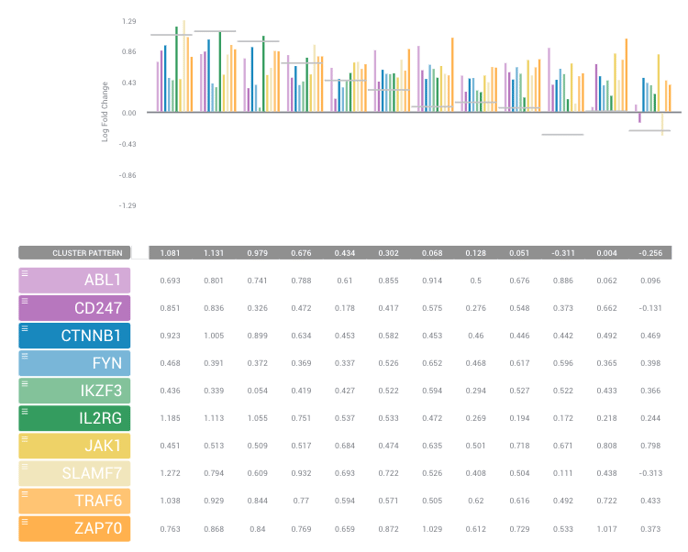
Meta-Analyses use a machine-based clustering algorithm to group each of your gene sets. The Average Pattern to the right-hand side of your screen gives you a summary of the gene expression for that cluster, where each bar corresponds to each comparison. ROSALIND also provides you with the associated pathways we've found to match your cluster (which we list by p-Adj value). You can go into more detail about each of your clusters by selecting the DNA icon directly to the right of the Average Patterns.
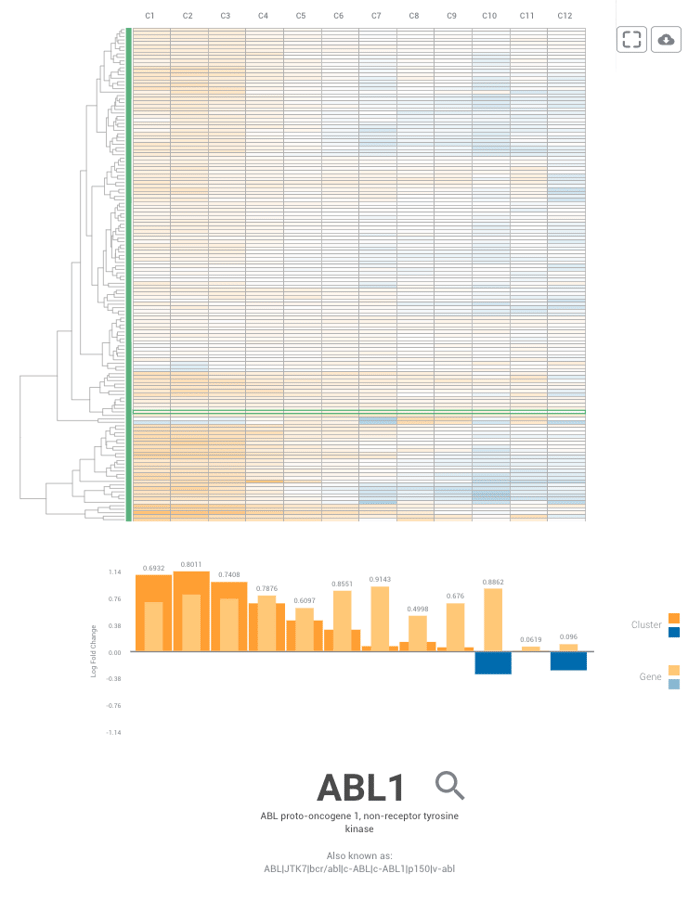
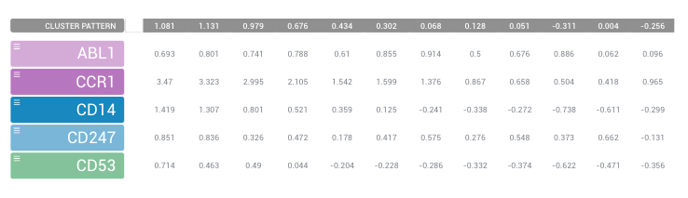
Once you've selected a specific cluster to review, you can then select genes of interest to compare using the list of genes on the left-hand side of your screen. Simply hold the Control (for PC) or Command (for Mac) key and use your mouse to select genes you'd like to compare. Once you have your list, you should see a table like the one listed below.
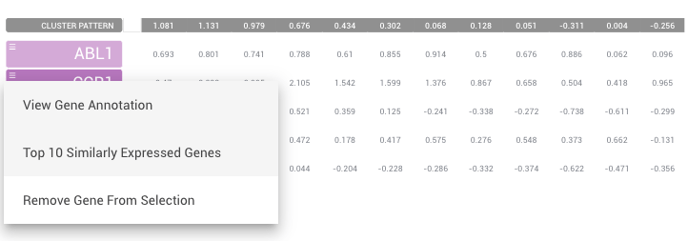
Select the symbol to the left of the gene if you like to get a view of the top 10 similarly expressed genes to the one you've selected. This may be able to help you find new therapeutic targets.
Conclusion:
Meta-Analyses are comparisons of comparisons that reveal patterns and insights among your experiments. You can run like datasets or datasets from different assay types (ex. RNA-seq and ChIP-seq) to look at a multi-omic Analysis. ROSALIND uses a machine-learning algorithm to cluster your genes and provides you with a complete heatmap as well as pathway interpretation for each cluster. You can select the DNA Icon to review each cluster more in depth.
Meta-analysis is available for Enterprise, Professional, and Academic subscriptions. You may visit our online store here to take a look at our various subscription options.