Chromatin Accessibility - See More Features

Analyze Chromatin Accessibility with ATAC-Seq

SLIDE

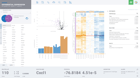
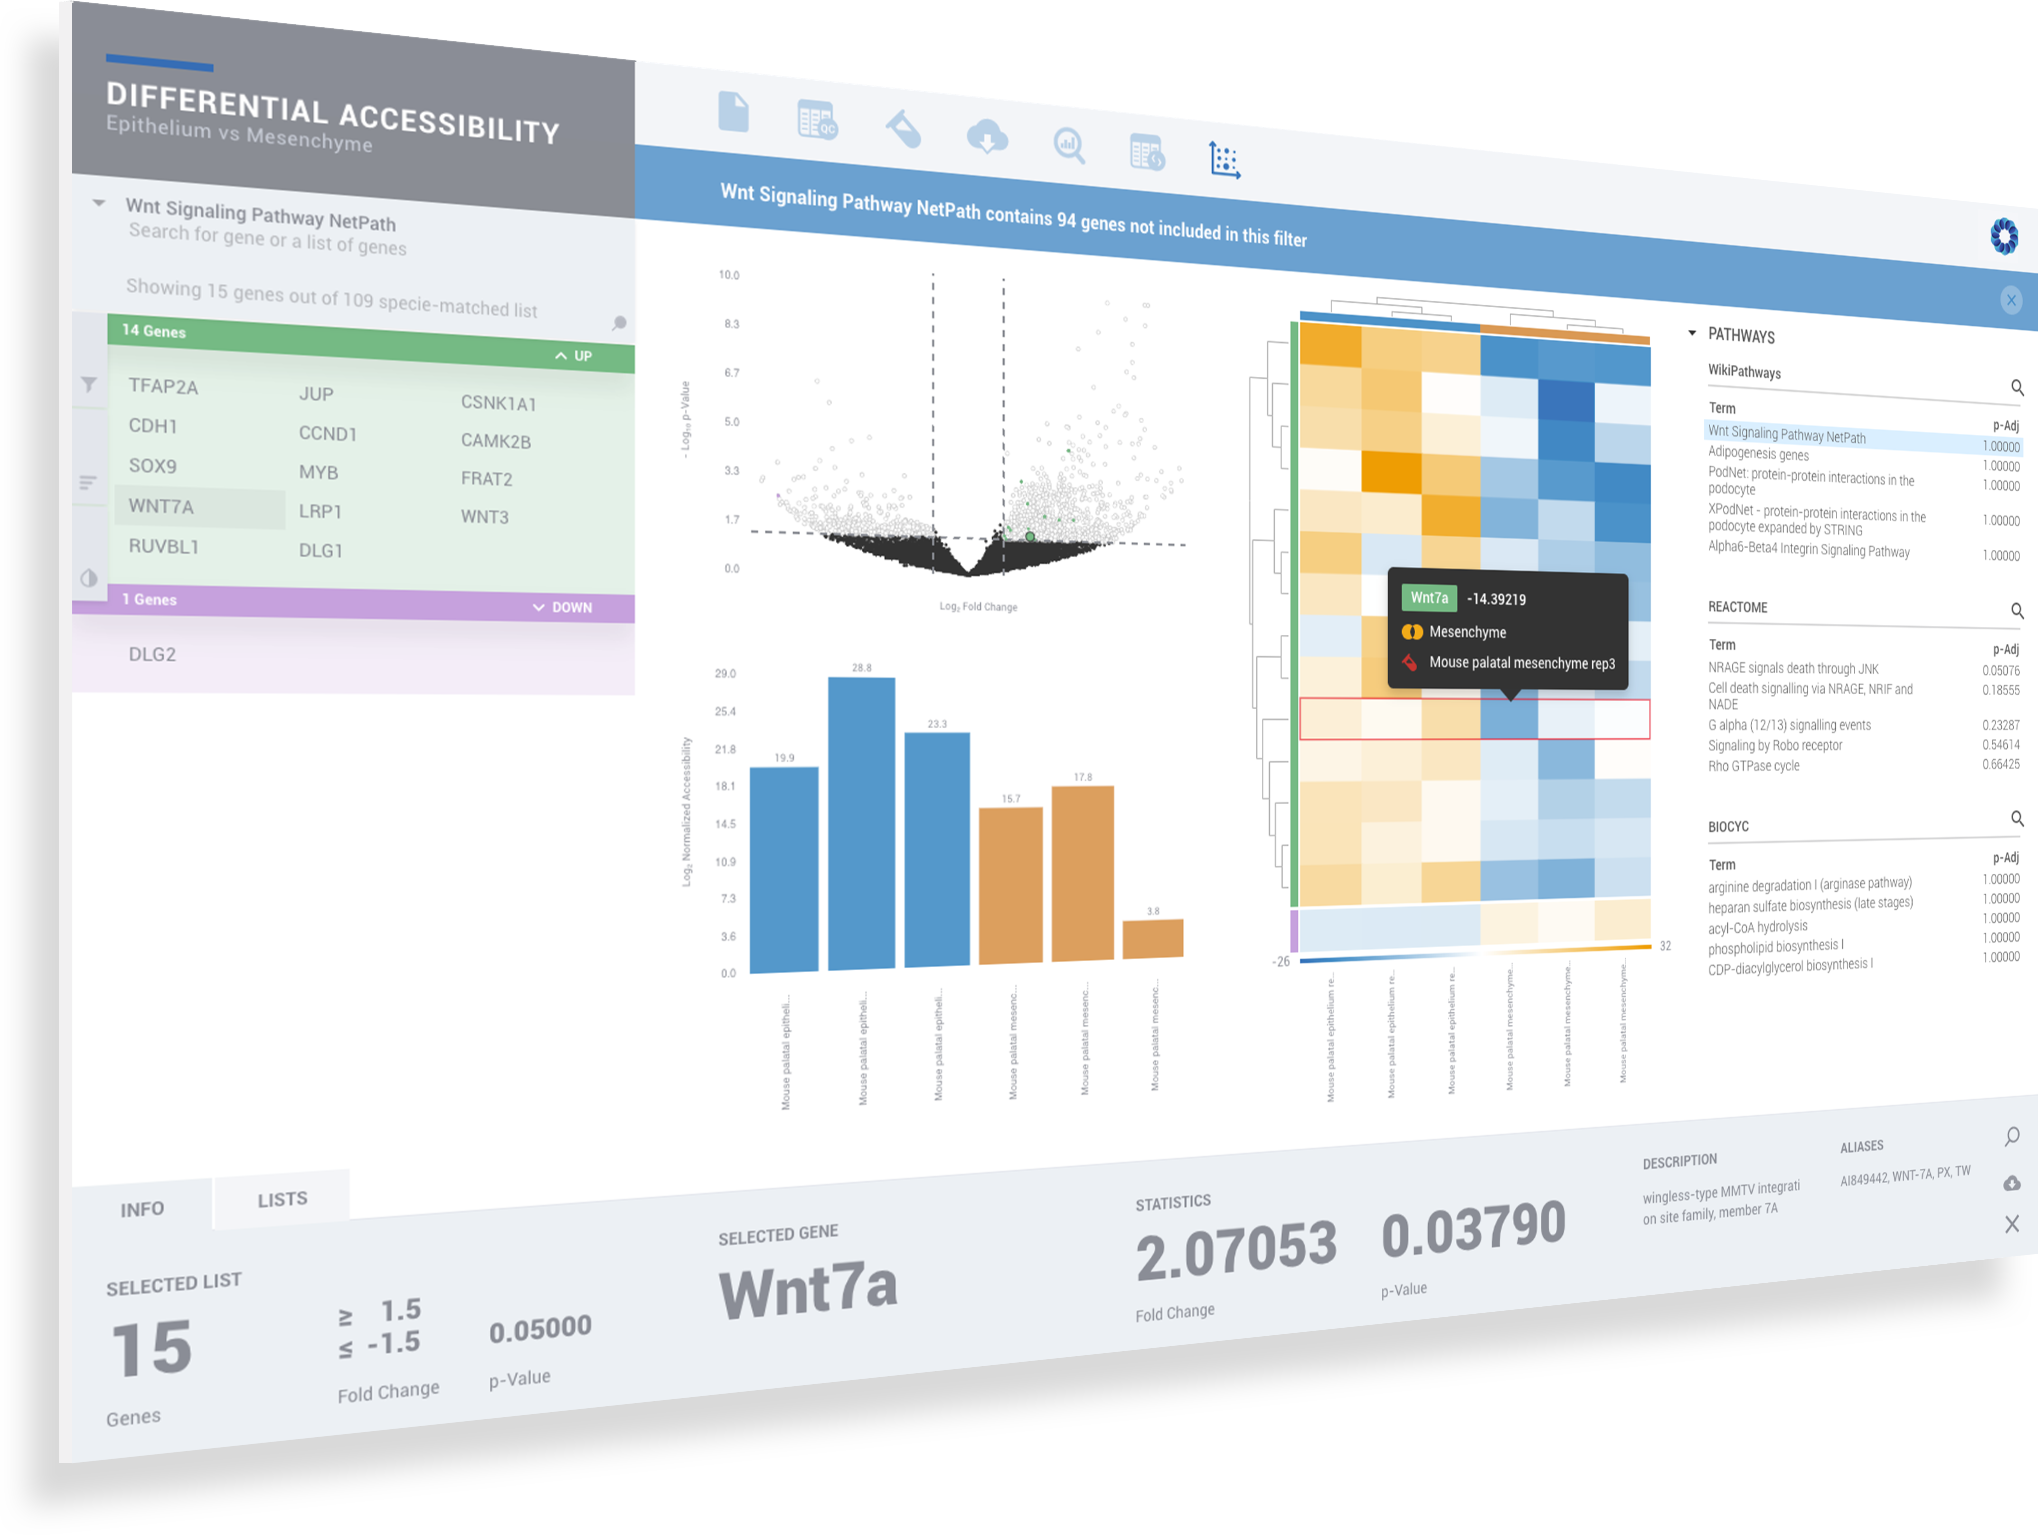
Explore differential Chromatin Accessibility visually and interactively

Seamlessly sift and sort through differential promoter accessibility by gene or top pathway. Change cut-offs with new filters. Validate gene signatures and discover new signatures.

Dynamic Volcano and MA Plots

View Chromatin Accessibility Across Samples with Box & Bar Plots

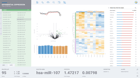
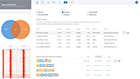
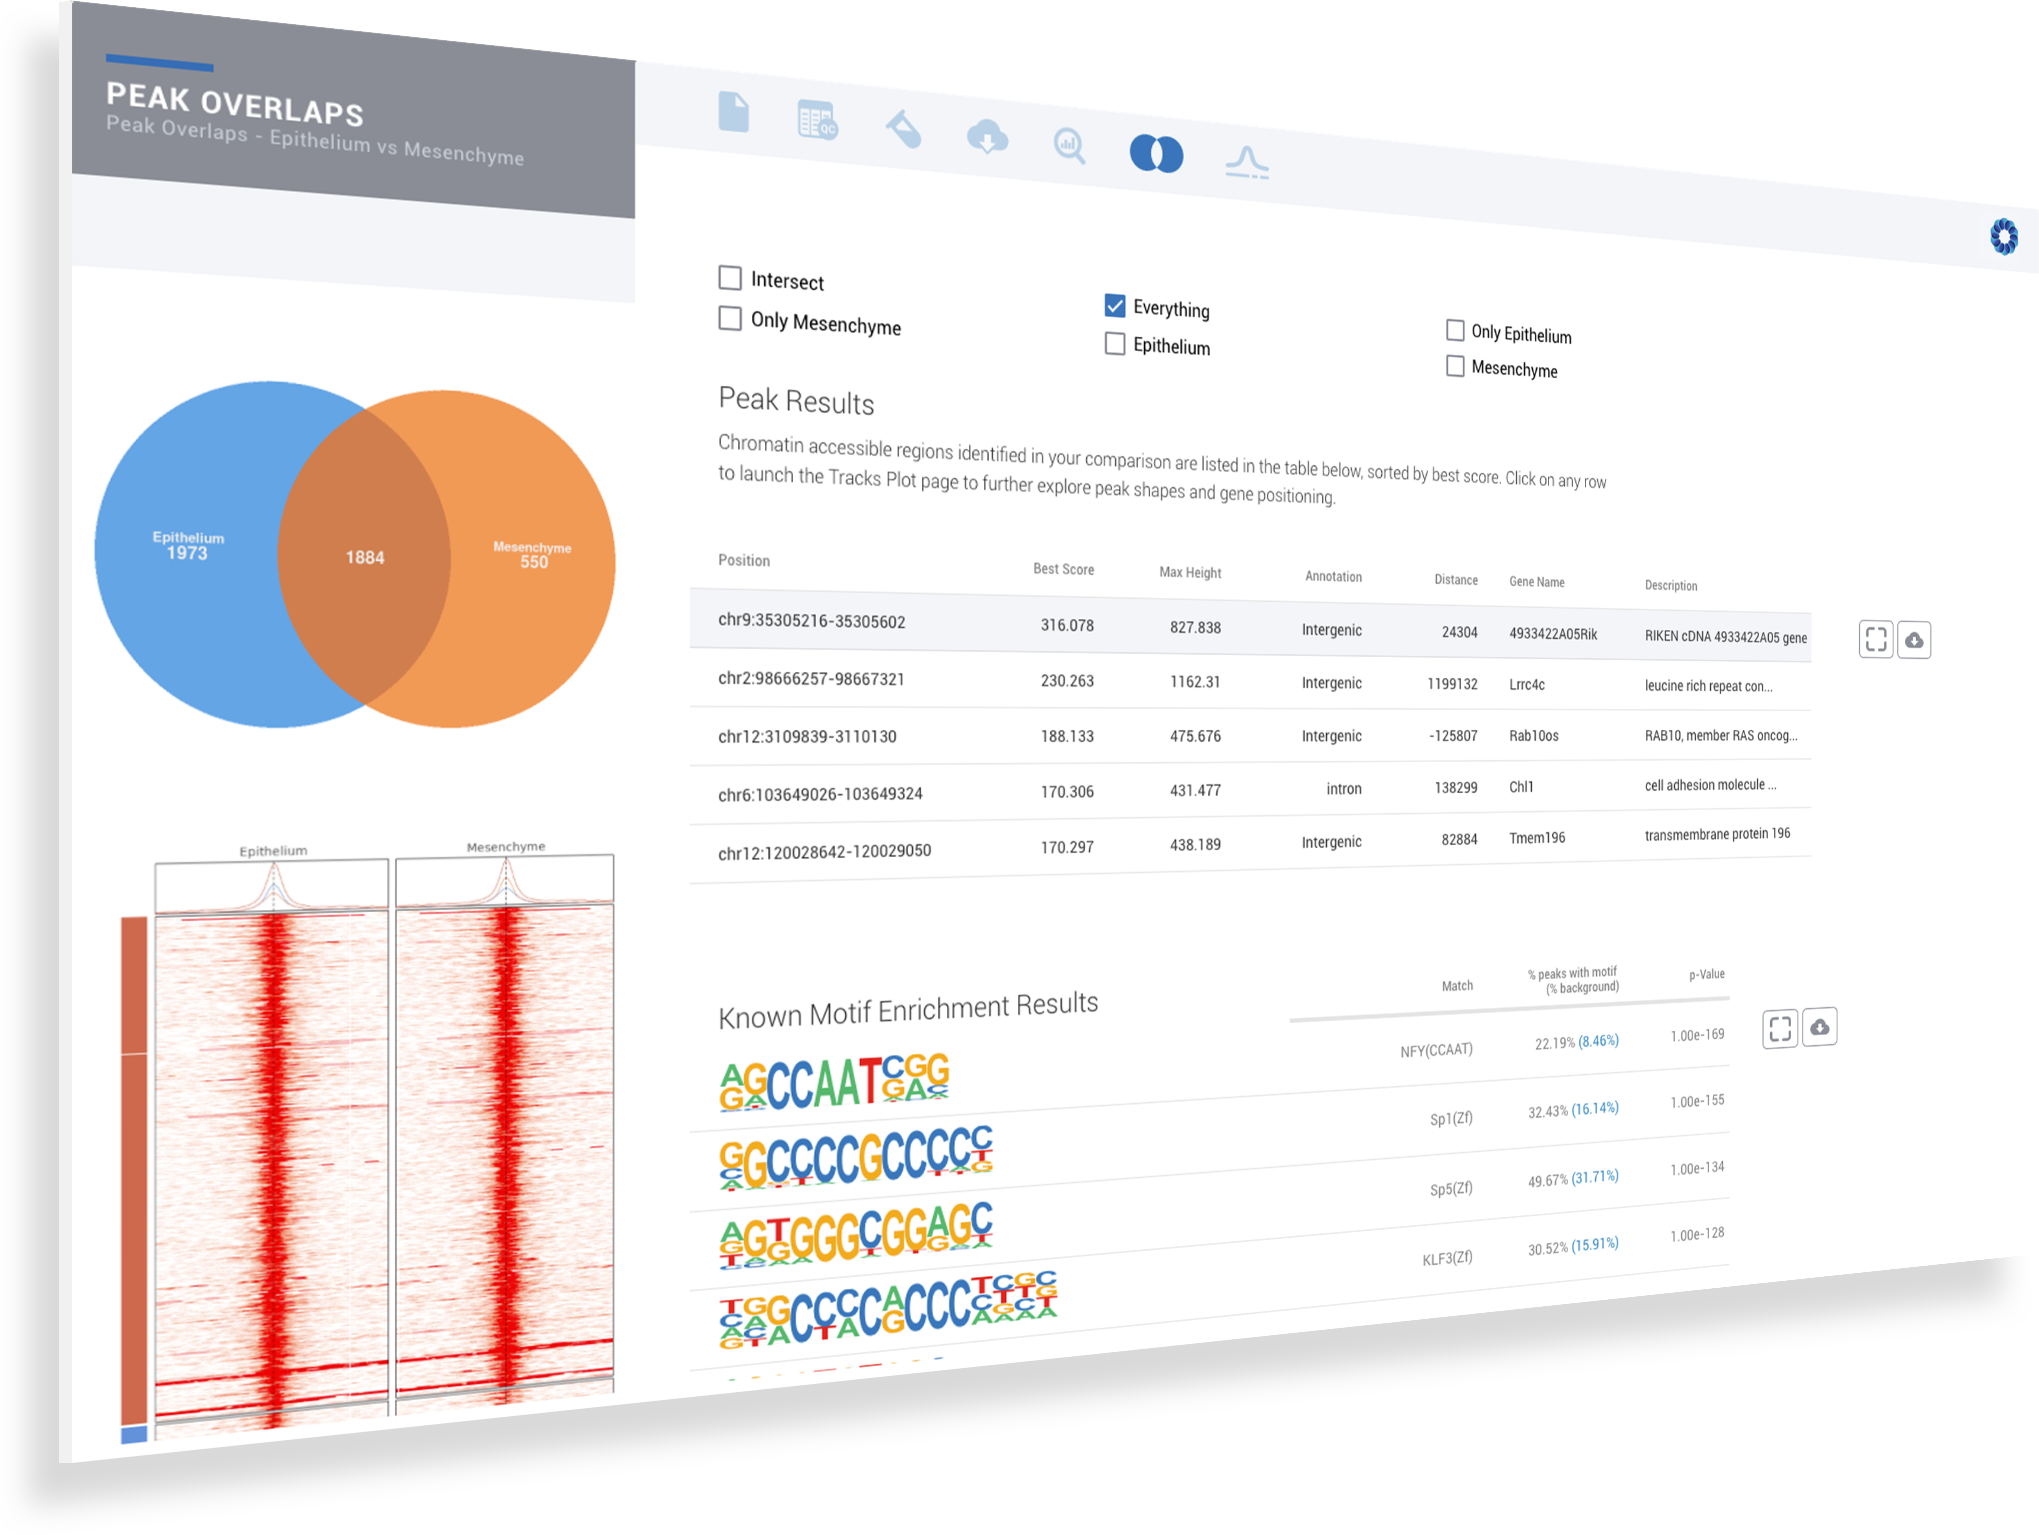
Explore overlaps in open chromatin regions

Using the Peak Overlap interactive analysis, identify unique and overlapping chromatin accessible regions across samples and comparison groups.

Select your samples intersections based on the Venn diagram

Explore the most significant chromatin accessible regions in the annotated table

Identify common and de novo motifs in accessible sequences

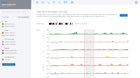
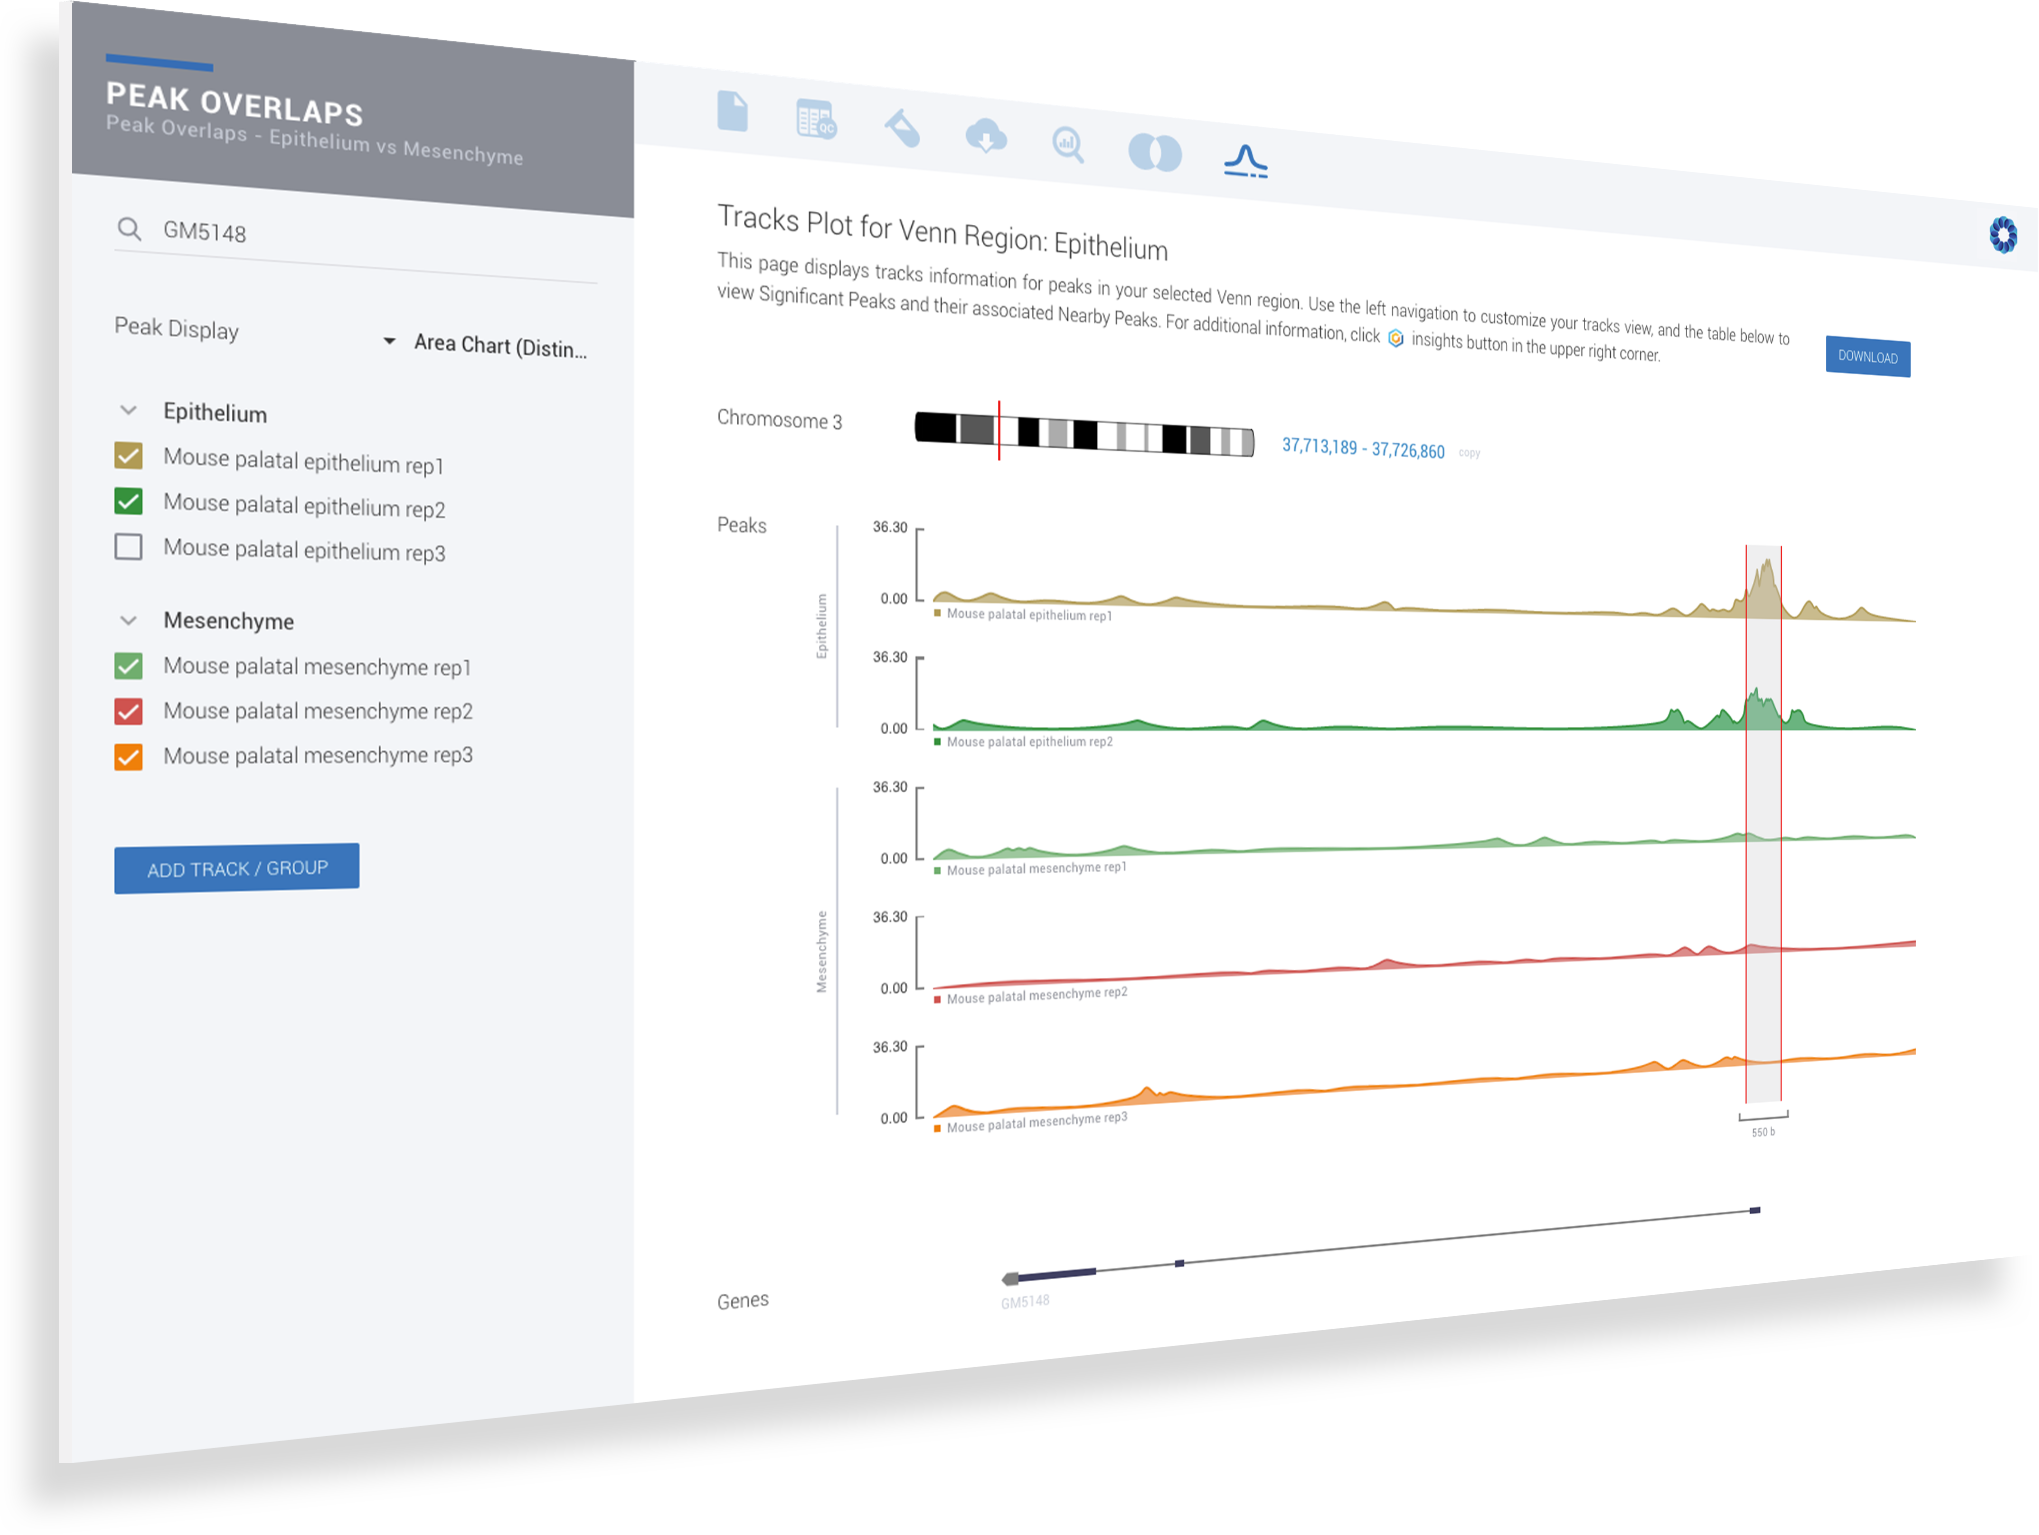
Visualize open chromatin regions

Locate areas of chromatin accessibility across samples using the integrated genome browser as well as the gene models annotations. Save the time, complexity, and inconvenience of exporting your data to UCSC or IGV.

Search by gene or chromosomal location

Organize samples by groups and select which tracks to display

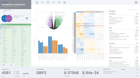
Advanced platform capabilities inside a simple to use dashboard

Explore your data immediately and stop waiting for results. Seamlessly create new filters to experiment with cut-off values while your interactive plots and interpretation are updated in moments.

Create unlimited filters with different levels of promoter accessibility and significance

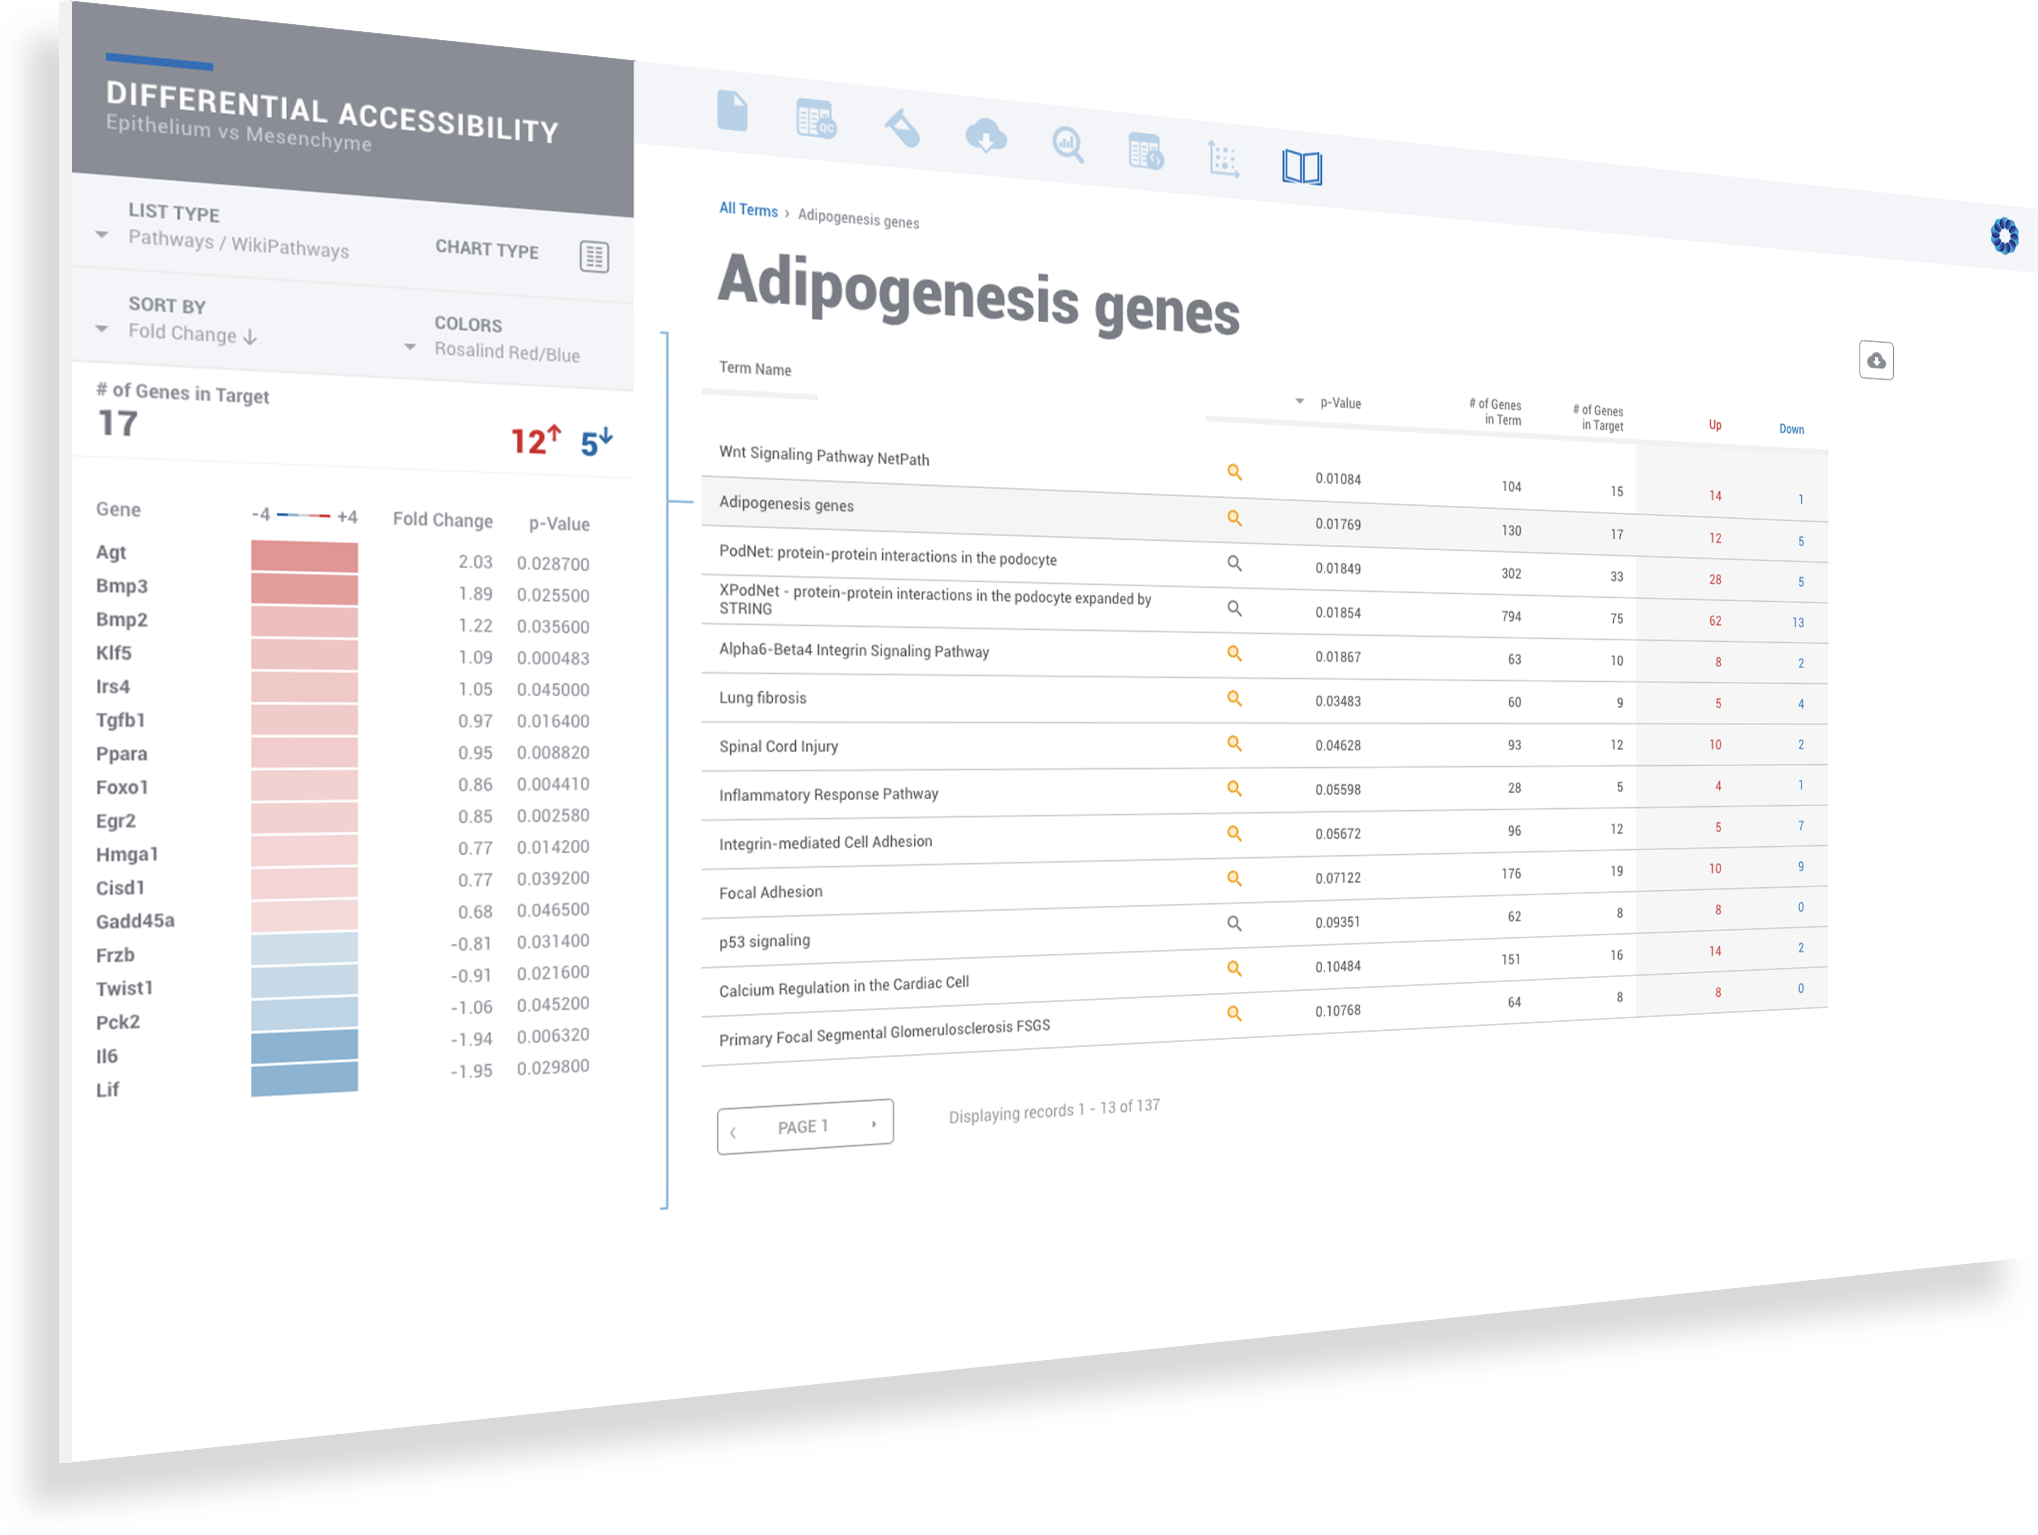
Explore downstream genes and enriched pathways

Dive deeper into the pathways and other knowledge bases

Pathways are shown and sorted by significance. Review the number of genes in each terms, including totals identifying opening or closing of the chromatin on their proximal promoters

Change to any ROSALIND knowledge bases with one click

Navigate the relationship between genes and pathways

Set Filter Parameters for Up-regulation, down-regulation and pValue

Click the orange magnifier to access annotated pathways diagrams

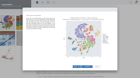
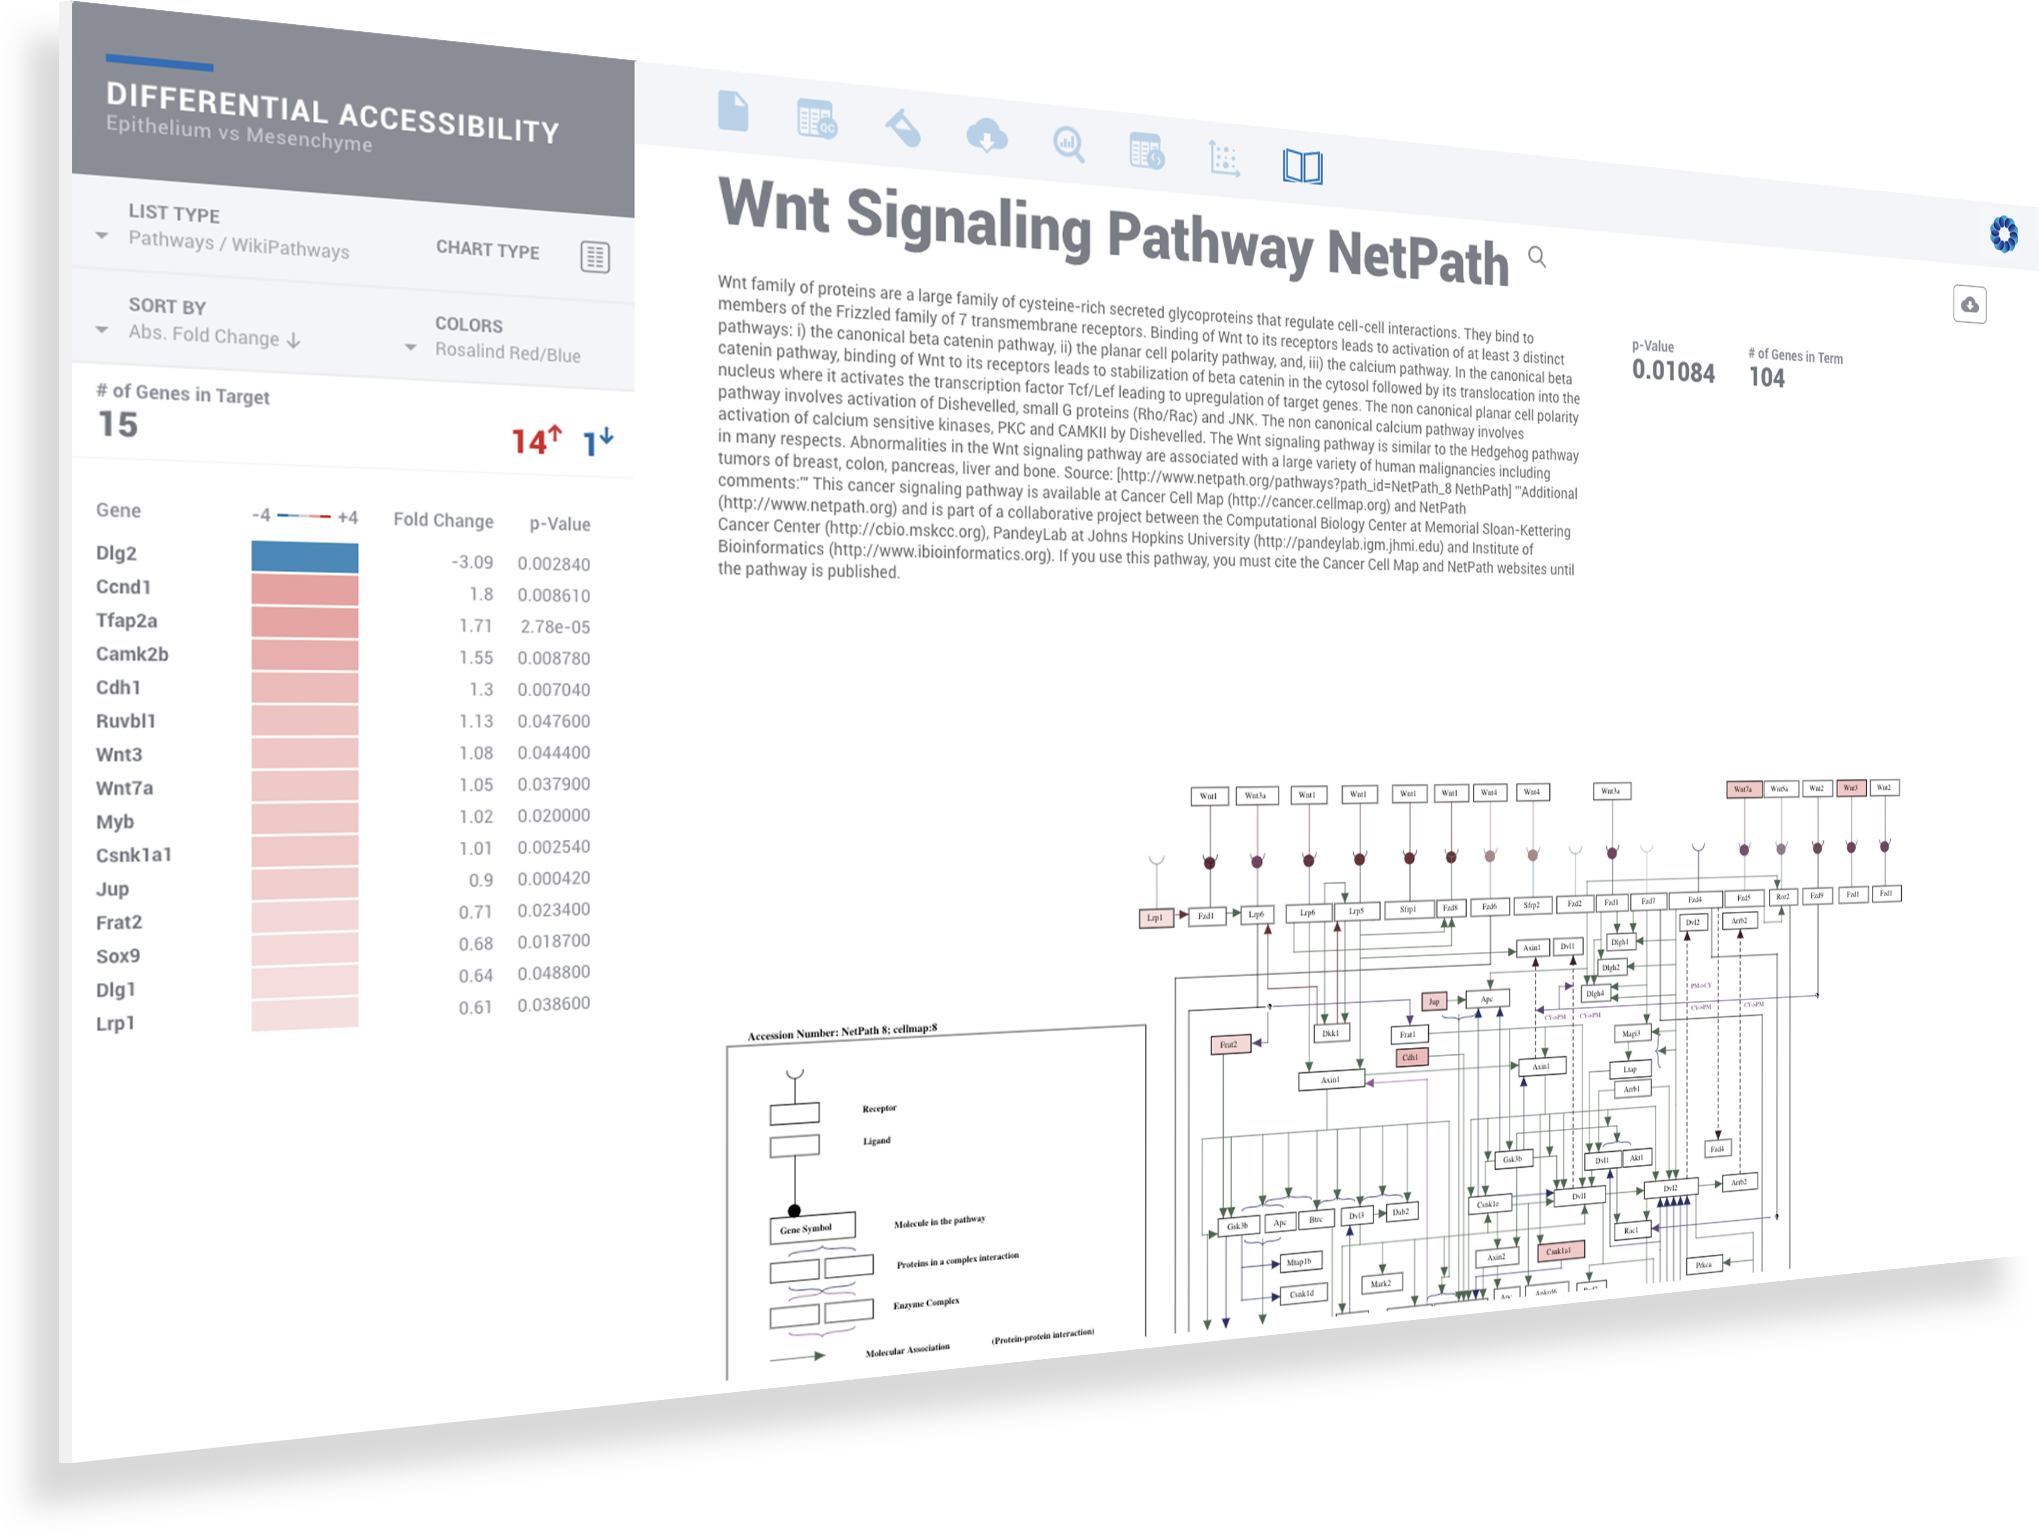
Access rich pathway diagrams colored by chromatin accessibility levels

Experience pathway diagrams with detailed descriptions, annotated accessibility change colors and gene heatmaps.

Interact with the pathway diagram to see corresponding genes highlight on the left

Interact with the gene list to see the corresponding genes highlight in the pathway diagram

Access external reference

Download publication-ready pathways diagrams in preferred colors

PAUSE PLAY SKIP
Differential Accessibility
Sample Accessibility
Genome Browser
Interactive Analysis
Pathway Exploration
Pathway Detail
SLIDE SLIDE SLIDE SLIDE SLIDE SLIDE
View More

How to Analyze ATAC-Seq Data with ROSALIND

Empowering Epigenetics Data Analysis & Interpretation

WHY STUDY CHROMATIN ACCESSIBILITY 


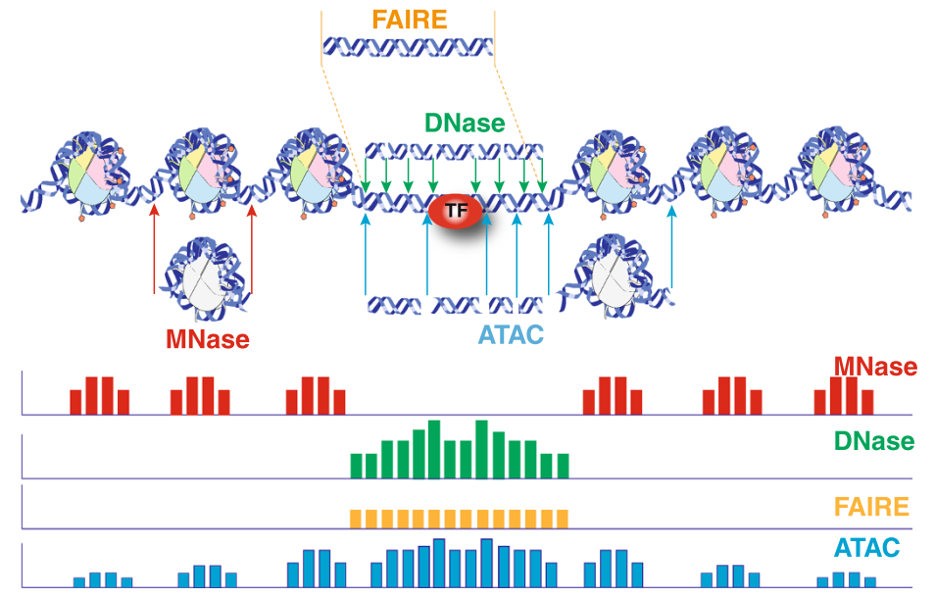
ATAC-seq (Assay for Transposase-Accessible Chromatin using sequencing) is a technique used in molecular biology to assess genome-wide chromatin accessibility. This technique is a faster and more sensitive analysis of the epigenome than DNase, MNase or FAIRE-Seq.

ATAC-Seq analysis is used to investigate a number of chromatin-accessibility signatures: The most common use is nucleosome mapping experiments, but it can be applied to mapping transcription factor binding sites or adapted to map DNA methylation sites.

ATAC-seq plays an important role in studying the evolutionary divergence of enhancer usage during development and uncovering lineage-specific enhancer maps used during cell differentiation. ATAC-Seq has also been applied to define the genome-wide chromatin accessibility landscape in human cancers and other diseases as well as finding cell-s specific binding sites and transcription factors using computational methods.


OVERVIEW


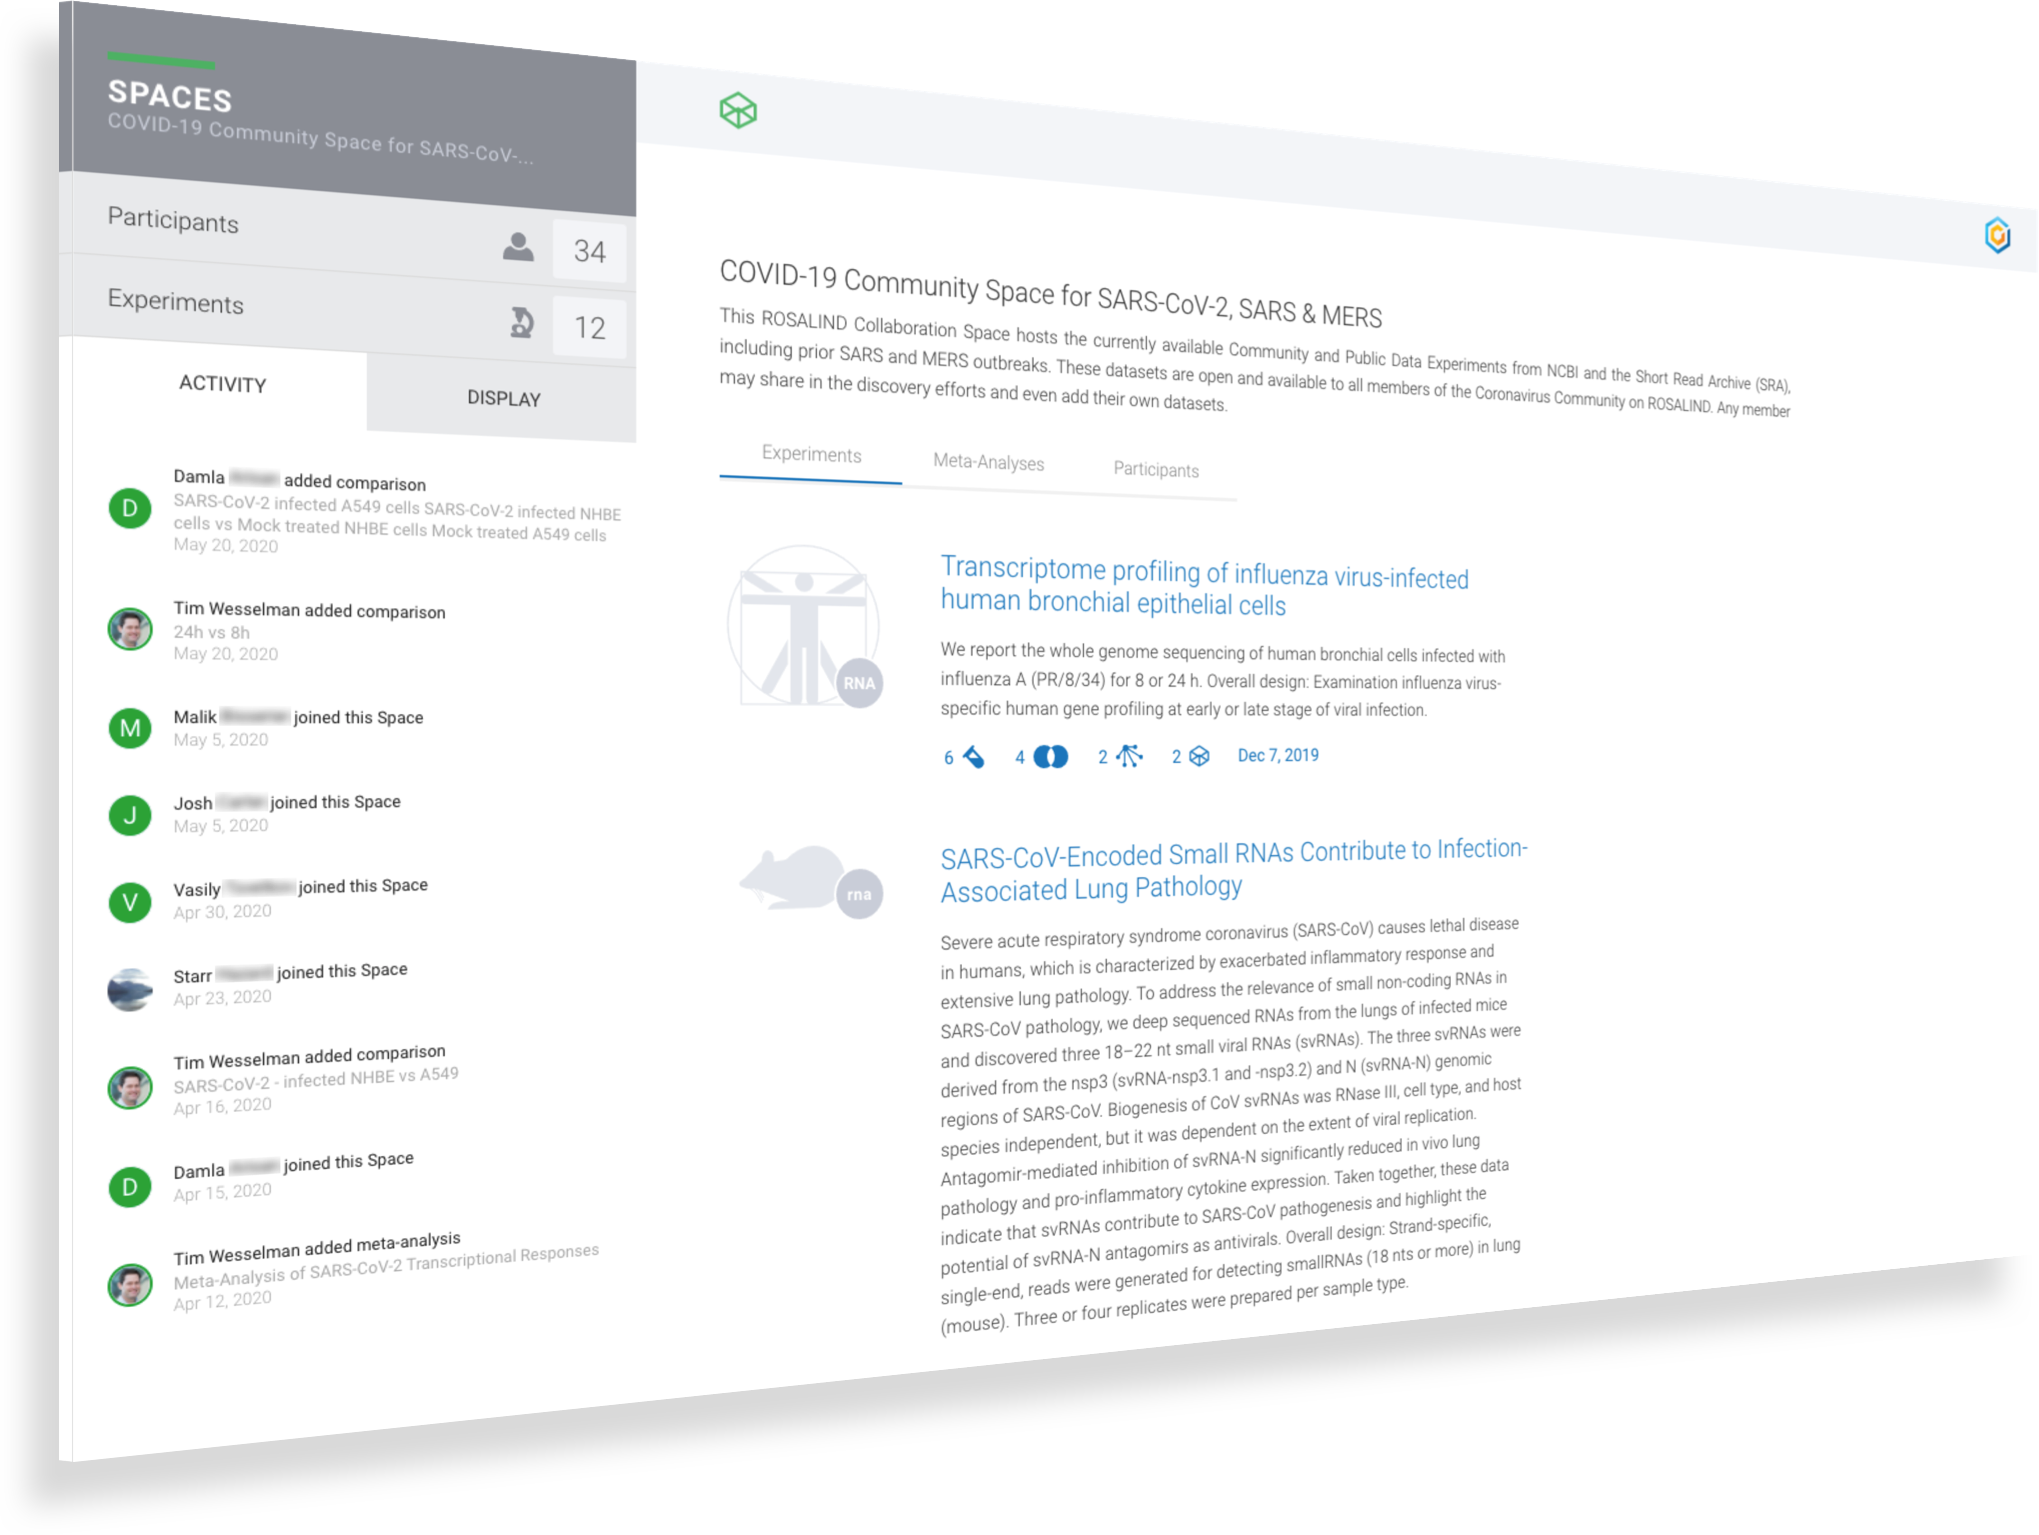
ROSALIND is a cloud platform that connects researchers to experiment design to quality control, peak overlaps, differential binding and pathway exploration in a real-time collaborative environment.

Scientists of every skill level benefit from ROSALIND since no programming or bioinformatics are required. By accepting raw FASTQ sequence data as well as processed counts data, ROSALIND enables powerful downstream analysis and truly insightful visualizations on gene expression datasets. Receive same-day results with every experiment in an interactive experience designed for ease of use and saving valuable time.

Explainer-ATAC


ANALYSIS & DISCOVERY CAPABILITIES


  • Analyze ATAC-seq data from FASTQ files
     
  • Record experiment design and custom attributes
  • Import NCBI Short Read Archive Public Data
  • Capture metadata with NCBI BioSample attributes
  • Perform covariate & batch corrections with differential comparisons
  • Setup comparisons using biological attributes
  • Create gene filters to adjust cut-off parameters
  • Download publication-ready figures and plots
  • Explore pathway, disease & drug knowledge bases
  • Real-time collaboration & results sharing
  • Multi-omic analyses across experiment & assay types

“ROSALIND is extremely easy to use and share results with other colleagues. Our scientists are able lookup results instantly without consulting our bioinformaticians.”

person2

Long Do
Sr. Manager, Informatics at Samumed LLC

FIVE STEPS TO SUCCESS WITH ATAC-SEQ DATA ANALYSIS


ROSALIND simplifies data analysis and works like a data hub interconnecting every stage of data interpretation. The ROSALIND chromatin accessibility discovery experience enables visual exploration and self-investigation of experiment results to give researchers the freedom to explore peak overlaps and differential accessibility. The peak overlap experience provides visibility into the presence of open chromatin regions anywhere in the genome and across multiple comparison groups. The differential accessibility experience focuses on accessibility of the proximal promoter region of genes. Based on the differential accessibility, each gene with open regions is displayed with visualization similar to gene expression, including heatmaps, volcano plots, MA plots, bar graphs and box plots. Within this interactive environment, one may adjust cut-offs, add comparisons and even find patterns across multiple datasets and experiment types - such as ATAC-seq, ChIP-seq or RNA-seq multi-omics analyses. There are five easy steps to performing ATAC-seq data analysis on ROSALIND.


1. EXPERIMENT DESIGN

Starting an ATAC-seq data analysis begins with creating a new experiment and capturing the experiment design. ROSALIND walks through the key aspects of an experiment in a guided experience to record biological objectives, sample attributes and analysis parameters. These details become the basis of the experiment discovery dashboard. Researchers who publish papers and work with NCBI public data know the importance of natively supporting NCBI data models. ROSALIND fully supports the NCBI BioProject and BioSample models for metadata assignment and sample attribute descriptions. ROSALIND also enables scientists to create custom attributes to describe biological behaviors in terms relevant to the experiment. The setup of comparisons is simplified by describing and annotating samples using these familiar terms. This methodology minimizes the risk of differential accessibility errors when selecting samples for comparison.

For ATAC-seq data analysis, ROSALIND analyzes the raw FASTQ files produced by high throughput sequencing. ROSALIND streamlines data analysis using an advanced pipeline for analysis that includes intelligent quality control with automatic contamination detection, identification of chromatin accessible regions and deep pathway interpretation of the genes close by. Visit the technical specifications section to learn more about the ROSALIND ATAC-seq data analysis pipeline and available reference materials.

For proper ATAC-seq results, an analysis pipeline must adjust for sample preparation and proprietary differences in library preparation kits used in the experiment. Not only is the kit selection important for targeting and capturing the desired chromatin openings, but the analysis pipeline also adjusts and optimizes for the kit’s unique characteristics, such as presence of unique molecular identifiers (UMIs) as well as the adapters used. ROSALIND integrates and supports a broad library of sample and library preparation kits, automatically calibrating each analysis with the appropriate details. To learn more about supported kits, visit the technical specifications section. Featured kits and instrument partners are also listed below.


2. ATAC-SEQ QUALITY CONTROL

Researchers must be confident in the quality control phase before gathering insights from an ATAC-seq experiment, otherwise, the results of the analysis should not be trusted. Biology’s mysteries are elusive and complex. Time should not be lost chasing corrective measures for outliers, contamination, swapped samples and the many other errors that can occur in the course of a well-designed experiment.

Some of the most important Quality Control metrics to verify are Q30 scores, alignment rates, duplicate rates, number of opened regions detected, sample correlation, fraction of reads in peaks, genomic regions and TSS plot for all samples. When ROSALIND detects low alignment, non-aligning reads are evaluated for possible contamination. For best results with Illumina sequencers, Q30 values should exceed 85% with alignment rates over 80% for the target species. Additional QC metrics, such as duplicate rates, should be less than 25% with fewer than 10% of reads trimmed. Researchers can eliminate offending samples and the deleterious effects on results by identifying the sample as an outlier and move confidently into the discovery and exploration phase of results interpretation.

ROSALIND Quality Control Intelligence identifies potential data quality issues and triages the data before presenting the results. This eliminates the need for researchers to be experts in Sequencing quality control issues. Learn how researchers gain confidence in their results through Quality Control Intelligence.


3. UNLOCKING RESULTS

After a researcher has reviewed the quality control phase the interactive presentation of results is ready to begin. The next step is to unlock the experiment. ROSALIND calculates the quantity of Analysis Units (“AU”) required to unlock the results. This is generally 1 AU per single-sample FASTQ file for ATAC-seq experiments, however, this may differ based on counts files or other experiment parameters. Account balances and quick links for acquiring more AU are directly accessible from the unlock screen. To learn more about Analysis Units, check out the Q&A in the section below, or visit the ROSALIND Store.


4. ANALYSIS & DISCOVERY

A typical ATAC-seq analysis provides a list of differentially accessible regions, generally in the form of a massive and obtuse CSV file. Unfortunately, this often results in more questions than answers for scientists. Multiple applications may also need to be used to generate this CSV file. Such applications often have a wide range of complexity with non-standard input/output formats, many of which are command-line tools requiring advanced knowledge in programming — an exercise well beyond the level of most biologists.

ROSALIND moves beyond the CSV file by providing a comprehensive dashboard for differential chromatin opening and interpretation of ATAC-seq data. Researchers begin with a list of significant differentially accessible regions determined by a calculated cut-off filter. Default settings for the filter begin with a fold change of +/- 1.5 with a p-Adjust lower than 0.05. Further adjustments to achieve a significant set of regions are performed by ROSALIND if needed. Researchers may also create an unlimited set of their own customized filters using fold changes and P-value parameters. Convenient on-screen controls are easily accessible for modifying filters, applying gene lists and signatures, and adjusting plot color palettes. The ROSALIND chromatin accessibility experience features deep interpretation of top pathways, gene ontology diseases, and drug interactions, as rich interactive plots that fill the screen and respond to interactions from the scientist, showing customizable heatmaps, volcano and MA plots as well as box and bar plots.

New comparisons and meta-analysis may be added at any time. Comparisons are created using BioProject attributes. Meta-analyses created can be cross experiments and multi-omic. Each of these perspectives are available within minutes of setup, reducing internal bioinformatic workload and enabling scientists to react fluidly by focusing directly on the science of the experiment.


5. COLLABORATION & DATA SHARING

The discovery process rarely ends with a single point of view from a single researcher’s opinion. ROSALIND Spaces enables true scientist-to-scientist collaboration through virtual data rooms where scientists and collaborators can come together on related datasets anywhere in the world to interactively explore shared experiments much like working with Google Docs. Researchers access a consistent version of the data, without the need to transfer unwieldy files or reinterpret origin files. All changes are interactive, instantly available, and viewable everywhere in the world (as authorized by the organization) with real-time activity feeds and historical reports. Spaces participants can add experiments, explore pathways, change cut-offs, add meta-analyses and add new comparisons all within the shared collaborative environment.

Spaces are virtual meeting rooms where scientists meet with niche experts, clients and supporting teams to maximize the discovery value of every experiment and prepare for the next one.

HIGHLIGHTS

DESIGNED FOR SCIENTISTS

ROSALIND is designed for the Scientist, so you can focus on the biology and science without having to invest months and months trying to learn bioinformatics, programming or biostatistics

POWERFUL

Capable of performing advanced analyses including contamination detection, covariate correction, batch correction and multi-omic analyses

EASE OF USE

Utilizing a clean, intuitive and immersive user interface, Scientists new to the platform ramp quickly with little training to focus on discovery

RICH DATA VISUALIZATION

Explore experiment results in high-quality, publiction-ready, interactive diagrams and plots

PATHWAY INTERPRETATION

ROSALIND is designed for the Scientist, so you can focus on the biology and science without having to invest months and months trying to learn bioinformatics, programming or biostatistics

START FROM FASTQ or PROCESSED DATA

Start new experiments by importing FASTQ files from sequencing, or counts (raw or normalized)

TRUSTED PIPELINES BUILT-IN

Built-in pipelines are tuned to utilize industry standard, widely published bioinformatics tools. For more information, review the ROSALIND specifications and method section

SECURITY AND ENCRYPTION

Every communication and data transfer on ROSALIND is encrypted and secured. Multiple layers of data protection ensure availability

FREQUENTLY ASKED QUESTIONS


faqPerson cube2b

I am not a bioinformatician. Can I really perform my own analysis?

faqROSALIND

Absolutely and other scientists just like you run their own analyses on ROSALIND every day. To learn more how to get started, check out the ROSALIND Quick Start Guide here.

faqPerson cube2b

Can the API be used to add experiments?

faqROSALIND

Yes, an experiment may be shared in any number of spaces to enable collaboration across multiple groups. Consistency, and security are preserved for the experiment within every space that it is included.

faqPerson cube2b

What types of experiments are supported?

faqROSALIND

The ROSALIND Gene Expression discovery experience supports RNA-seq, NanoString gene and protein panels, and Micro-Array (via counts). Other analysis types include Single Cell, smallRNA-seq, ATAC-seq, and ChIP-seq. We are constantly enhancing our platform and more analysis types are on the way. 

faqPerson cube2b

Can I download my results and plots?

faqROSALIND

Yes. All plots, diagrams, source and results files are downloadable on ROSALIND. Look for the Download buttons to access publication-ready figures as well as to download all experiment datasets.

faqPerson cube2b

What types of input files are supported?

faqROSALIND

For Gene Expression experiments, FASTQ files and count files are supported. Compressed FASTQs will have faster upload times. Supported file types: .FASTQ, .FASTQ.GZ, .CSV, .TXT, .RCC (NanoString only)

faqPerson cube2b

Can I leave a Space and remove myself from the collaboration?

faqROSALIND

Any participant can leave a Space at anytime. Doing so removes their access and will require a new invite to join the collaborative Space again. Only the owner of a Space or an Enterprise Administrator may remove participants.

faqPerson cube2b

What is an Analysis Unit and how is it used on ROSALIND?

faqROSALIND

Samples that are processed on ROSALIND require an Analysis Unit to unlock the ROSALIND discovery experience. Analysis Units are already included in most subscriptions on ROSALIND. Additional Analysis Units may be purchased in packs of 10 or 50 from the ROSALIND Store. Analysis Units do not expire. A current subscription is required to utilize Analysis Units. Enterprise Subscriptions provide additional flexibility for high-volume environments. Please contact sales to learn more sales@onramp.bio

faqPerson cube2b

What is considered a Sample?

faqROSALIND

Any sample that is prepared for processing on an instrument is considered a Sample for ROSALIND. If a Scientist takes two (2) aliquots of an original sample to have replicates and prepares a library for each, this would be considered two (2) Samples on ROSALIND. On the other hand, a Sample may have multiple files associated with it, depending on how sequencing is performed. A single sample may be single-end, paired-end, and also multi-lane and will still be considered as one (1) Sample.

Accelerating Health Through Research Innovation.

Start Your Free Trial

Receive the free ROSALIND Quick Start Guide with your trial

  • Learn how biologists who need faster results get their work done
  • Easy step-by-step walkthrough to complete your first experiment in under 5 minutes
  • Invite colleagues to collaborate on your experiment in real-time
quick-start-guide best-of-show
footer-1-1
footer-2
footer-3
footer-4
footer-5
footer-6