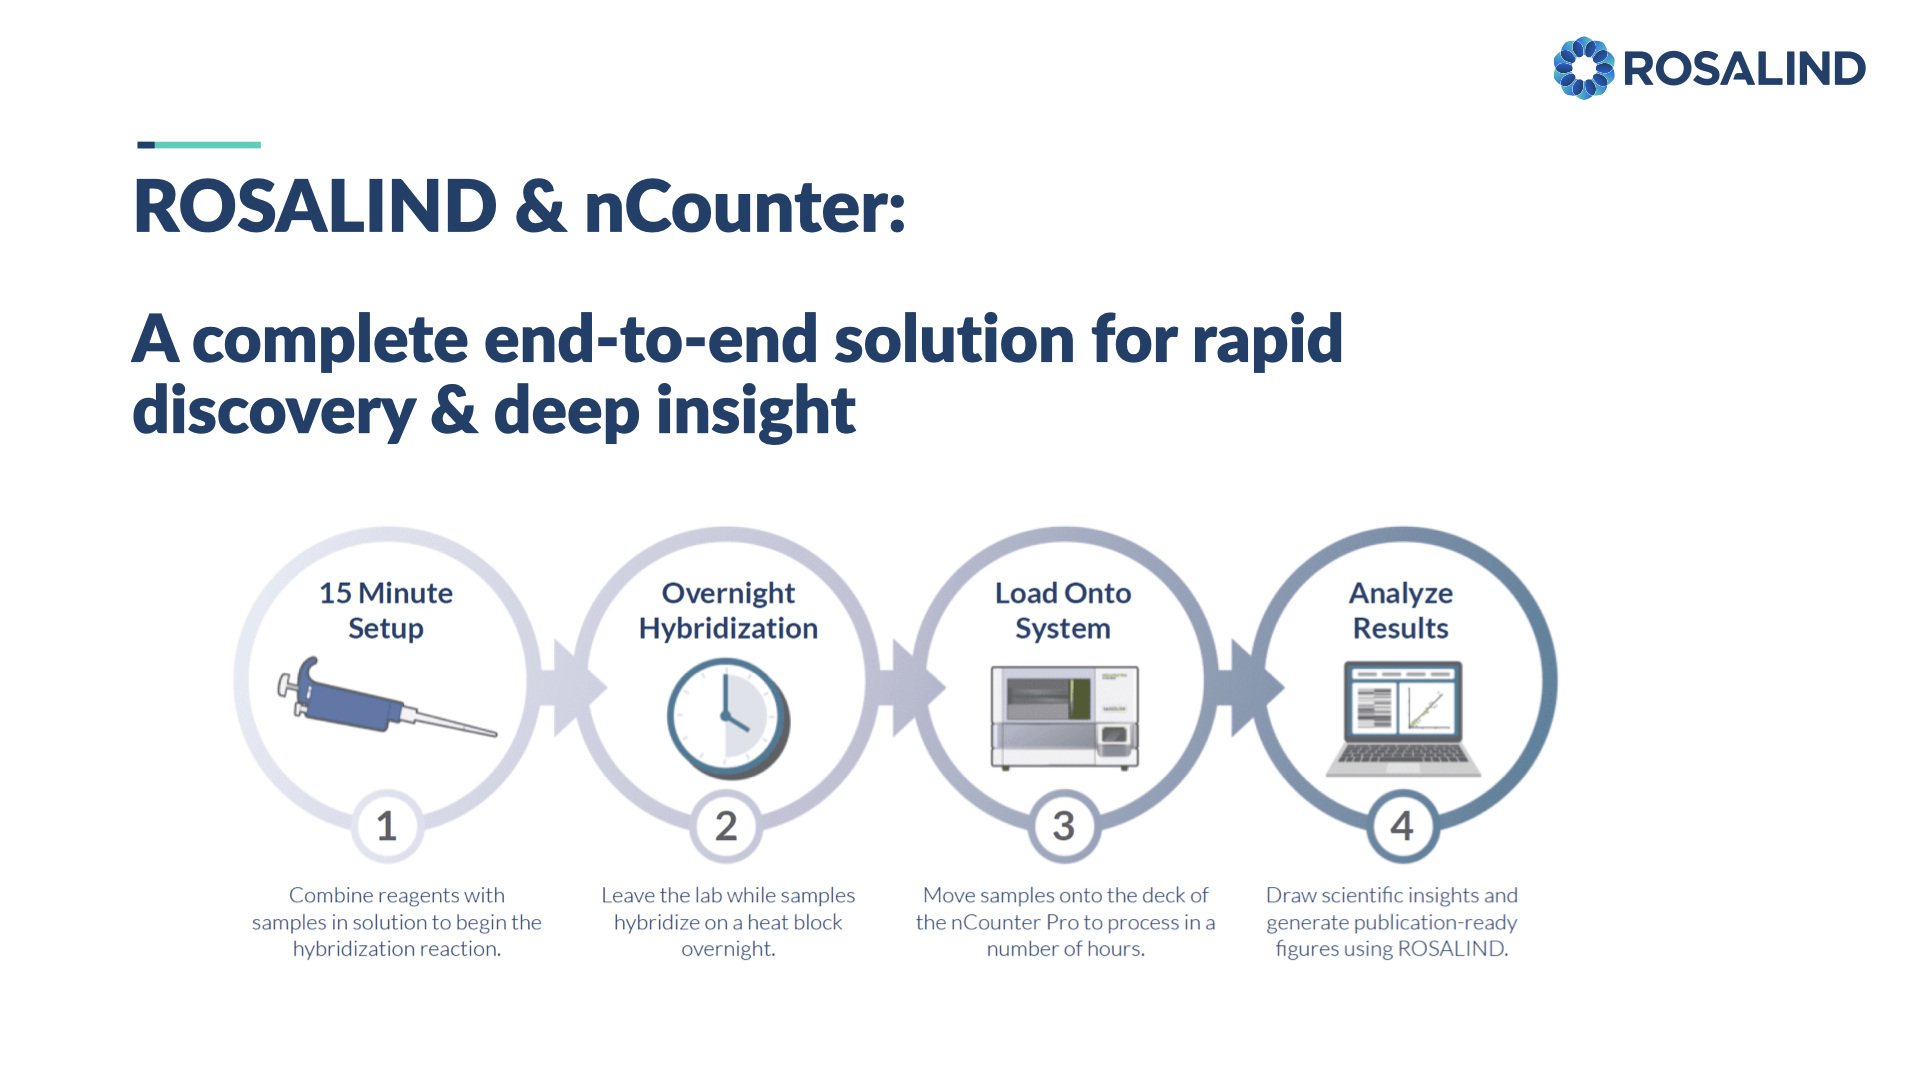
Get the Most from Your nCounter Data: The Way It Was Meant to Be
You chose nCounter for its unmatched precision, sensitivity, and robustness—the gold standard for targeted gene expression. But the power of your data is only as strong as your analysis.
With800 carefully selected genes, every data point matters. Outdated, complex, and difficult-to-use free software can’t deliver the accuracy and insights your research demands.
That’s why ROSALIND is essential, ensuring you extract the deepest, most reliable insights from your targeted panel.
Whether you’re driving a drug discovery project or preparing for a grant application, every decision depends ontrustworthy, precise data analysis. In today’s world of constrained budgets and competitive funding, you can’t afford to lose key insights to subpar analysis.
nCounter gives you the best data. ROSALIND ensures you get the best answers.
Exclusively, Best Data Analysis for nCounter Instruments
As NanoString's strategic partner for data analysis, ROSALIND brings a seamless and enhanced nCounter experience to your laboratory. Our platform integrates directly with NanoString technologies to deliver a streamlined workflow and superior data analysis capabilities, specifically tailored for nCounter data, including RAW RCC files as well as processed data exports.
This unique experience features custom normalization, advanced cell type profiling, and effective pruning of low expressors—all designed to refine data clarity and improve analytical accuracy. With intuitive interfaces and real-time processing, Rosalind makes complex data analyses accessible and actionable for all levels of scientific research.
Designed for Scientists At Every Step of Your Analysis
Scientists of every skill level can benefit from ROSALIND since no programming or bioinformatics skills are required. With NanoString nCounter, scientists have full control from the lab to powerful downstream analysis, collaboration, and pathway exploration.
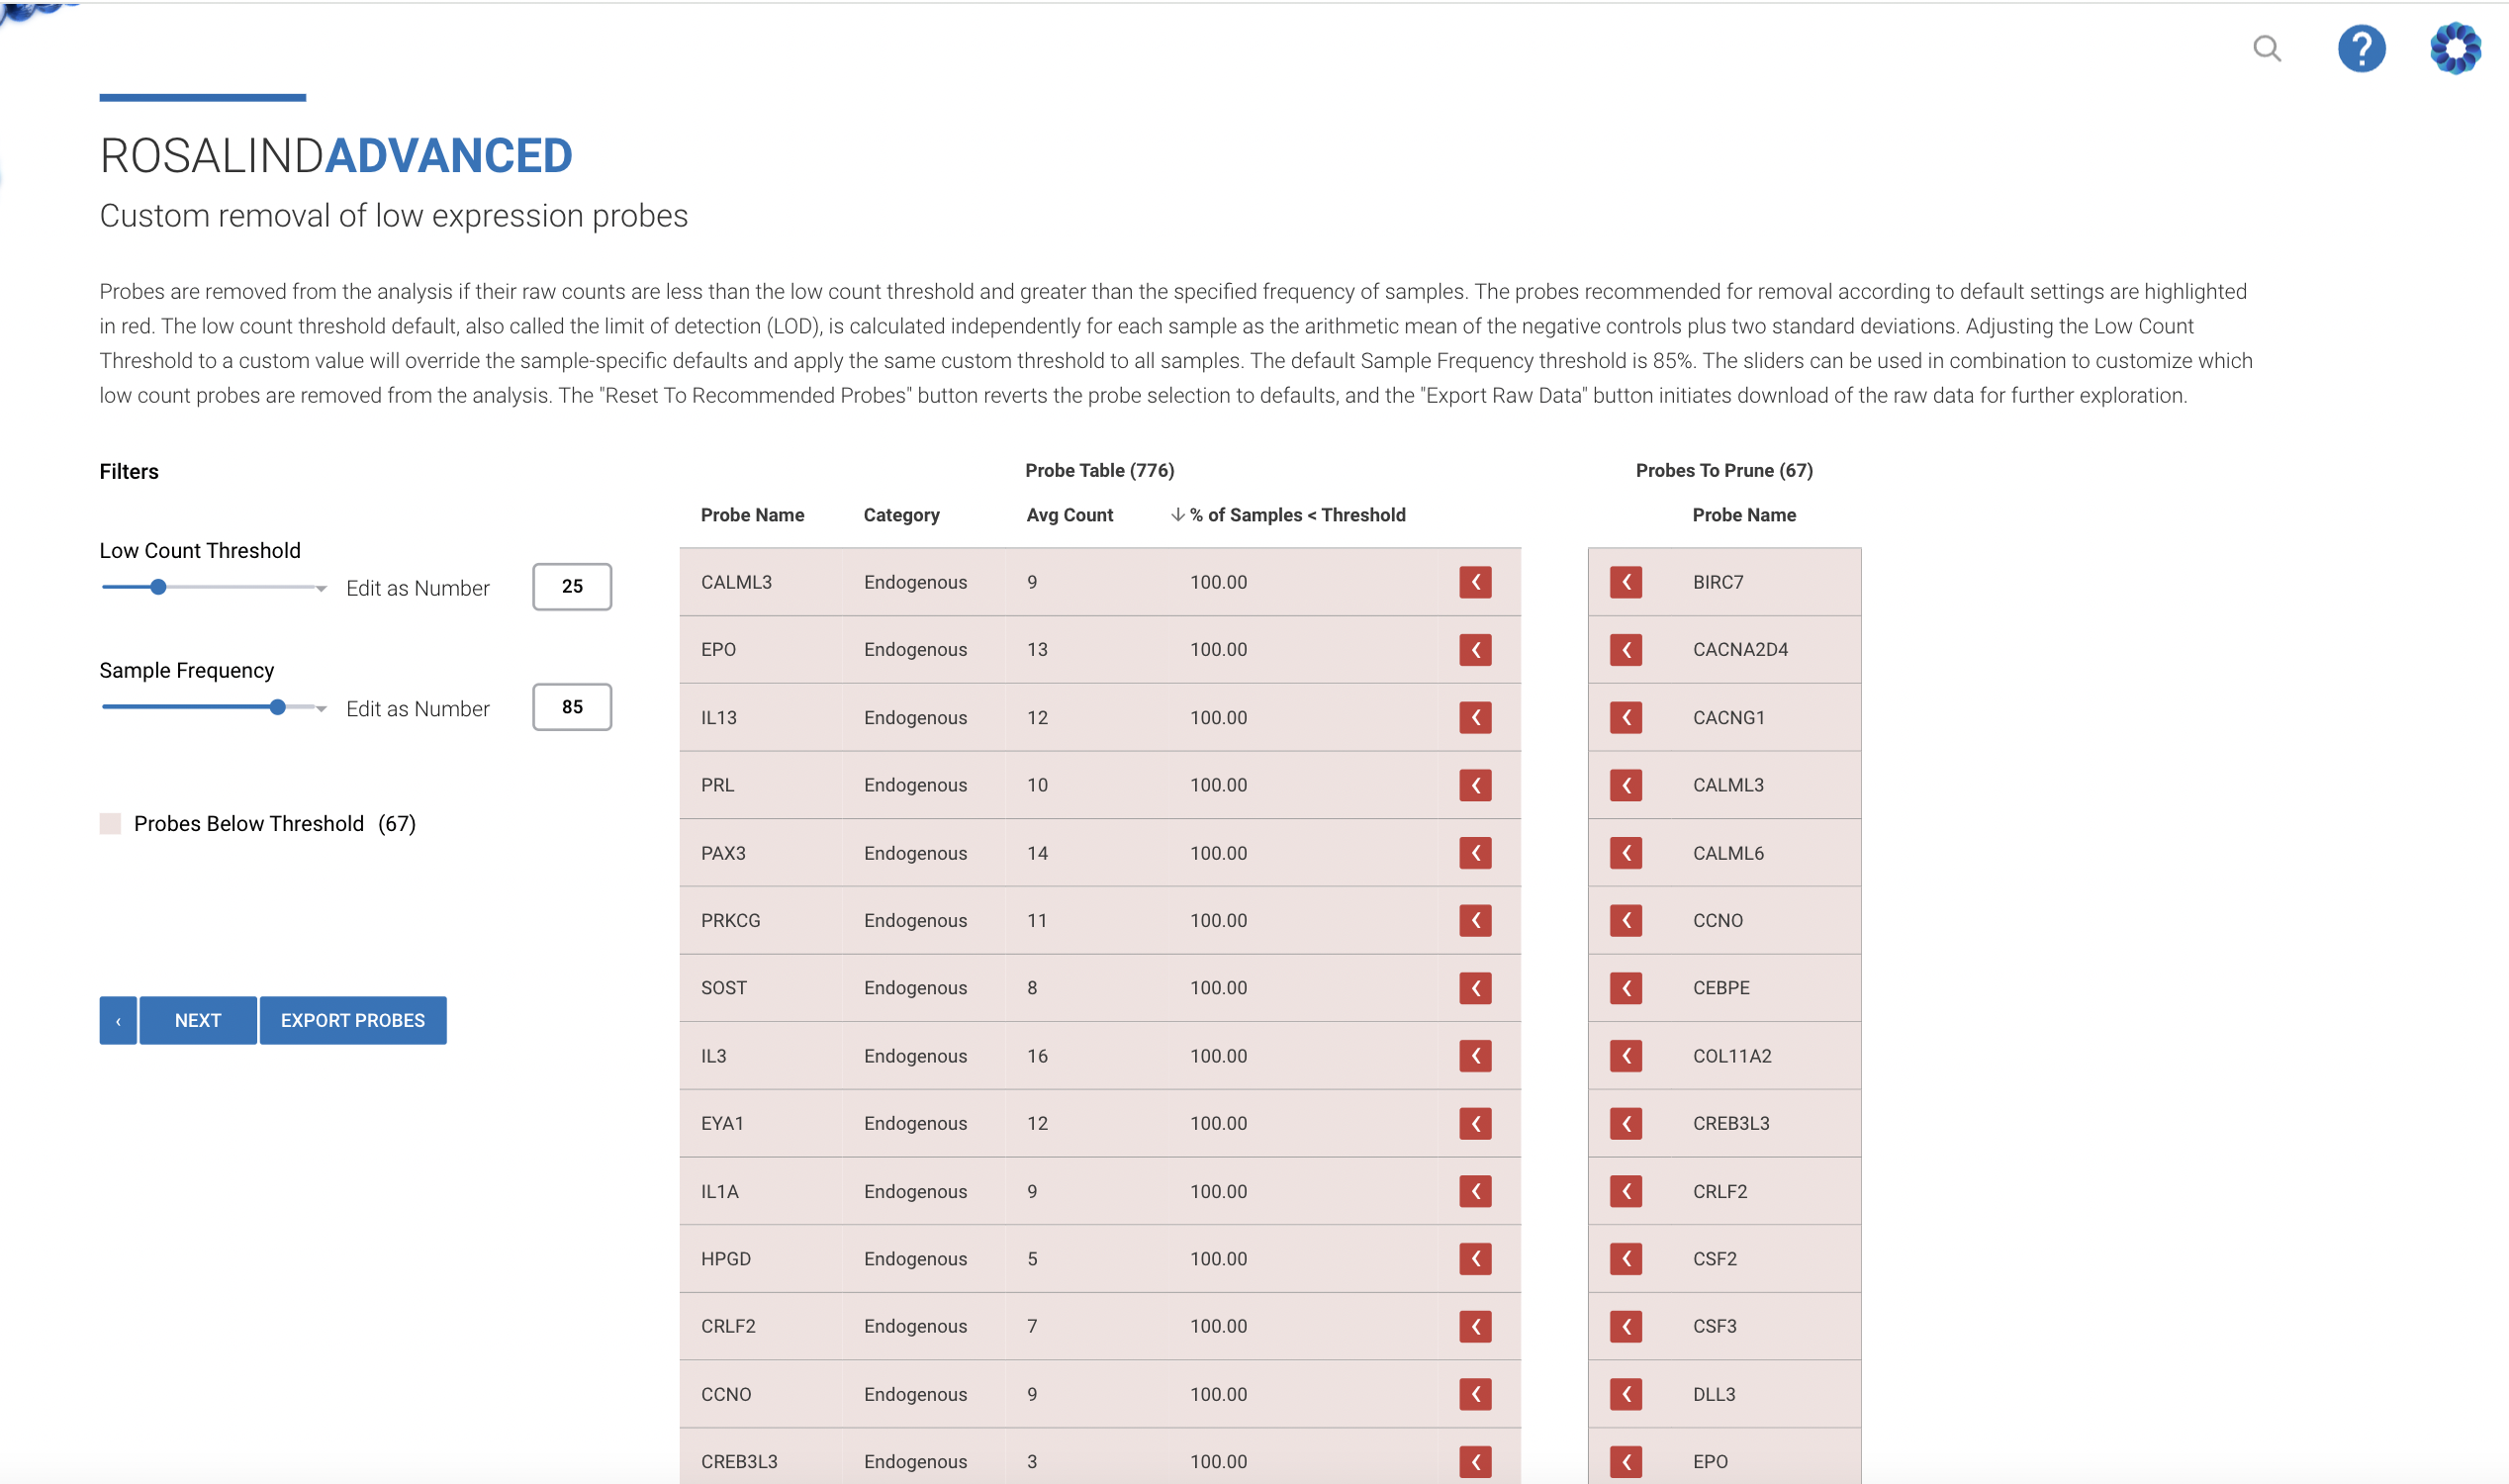
Remove Low Expression Probes
Custom pruning of low expressors is vital for researchers as it significantly reduces background noise and enhances the clarity of the data. By focusing on genes with higher expression levels, scientists can avoid misleading results caused by random fluctuations in low-expressed genes.
ROSALIND automates this process, integrating advanced algorithms that intelligently identify and eliminate these low expressors, streamlining workflows and improving data quality.
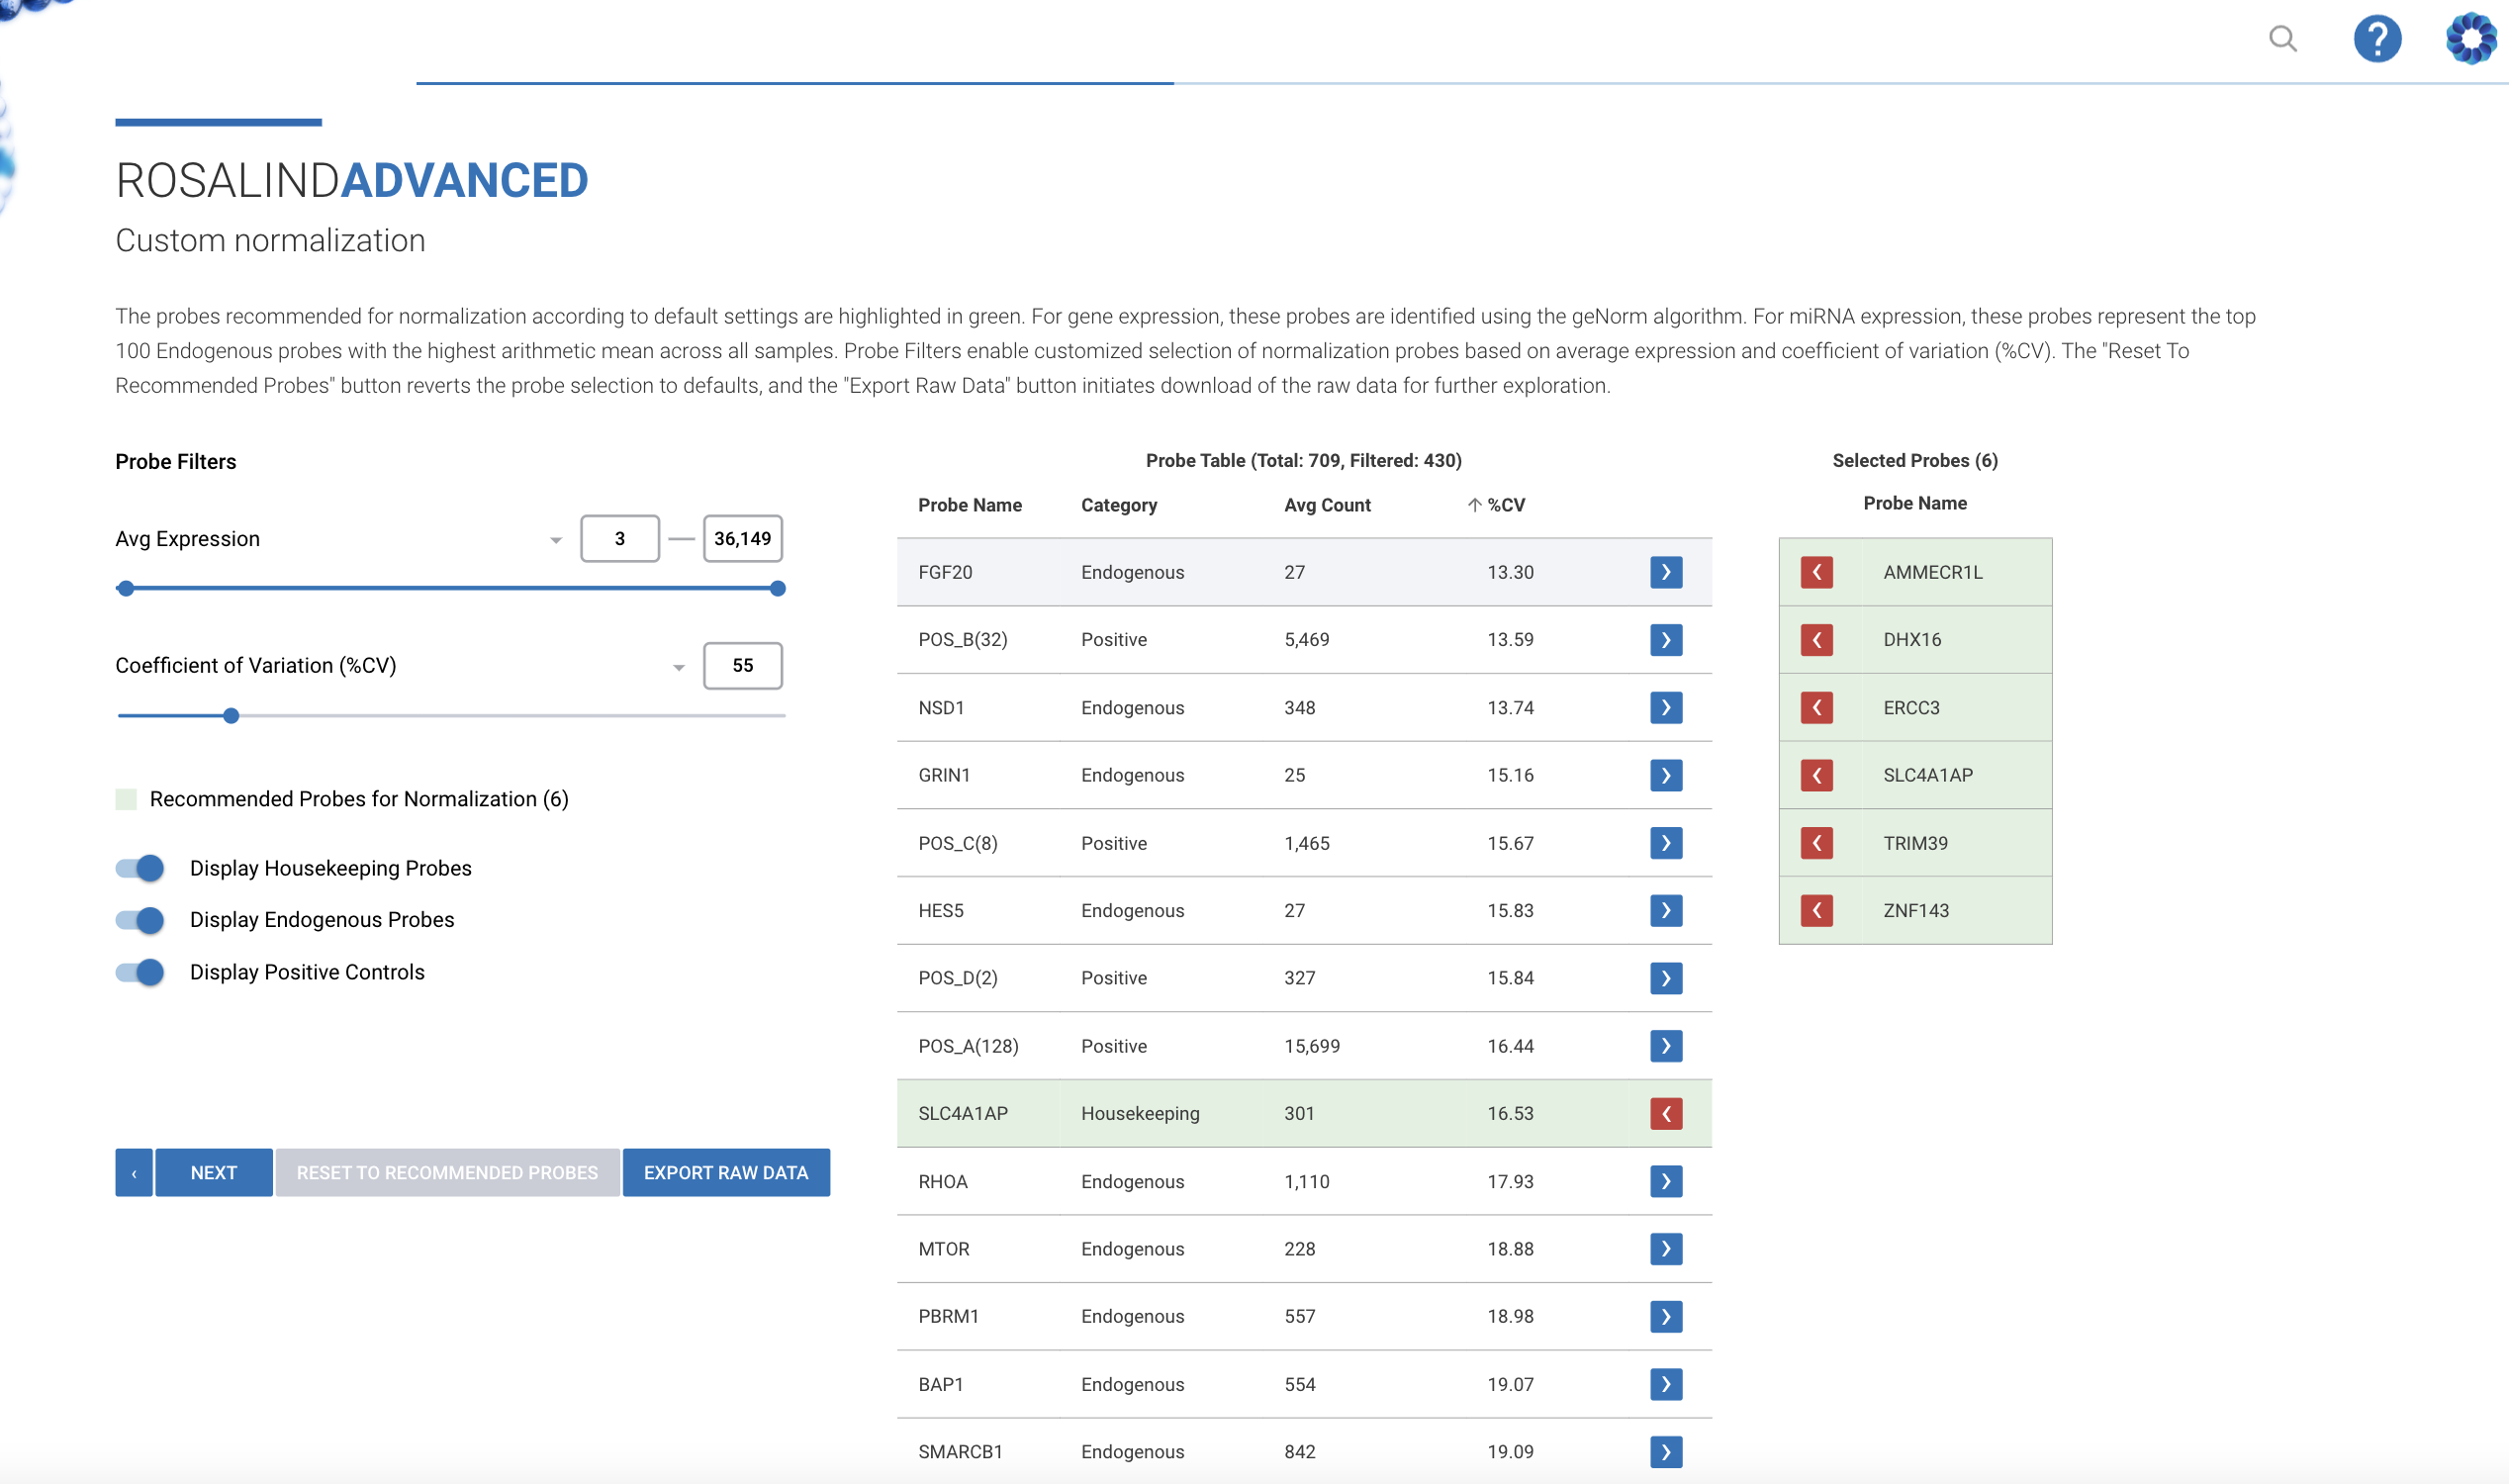
Master Custom Normalization with Bioinformatics Ease
Leverage the power of expert-level bioinformatics with the sophistication of ROSALIND's Custom Normalization. Our platform brings geNORM's advanced capabilities directly to your fingertips, allowing you to effortlessly identify and select the most stable reference genes for precise normalization.
By guiding you to the optimal genes and enabling the export of your selections for consistent application across multiple analyses, ROSALIND empowers your research with the methodologies championed by leading bioinformatics teams, ensuring your data's integrity and reproducibility.
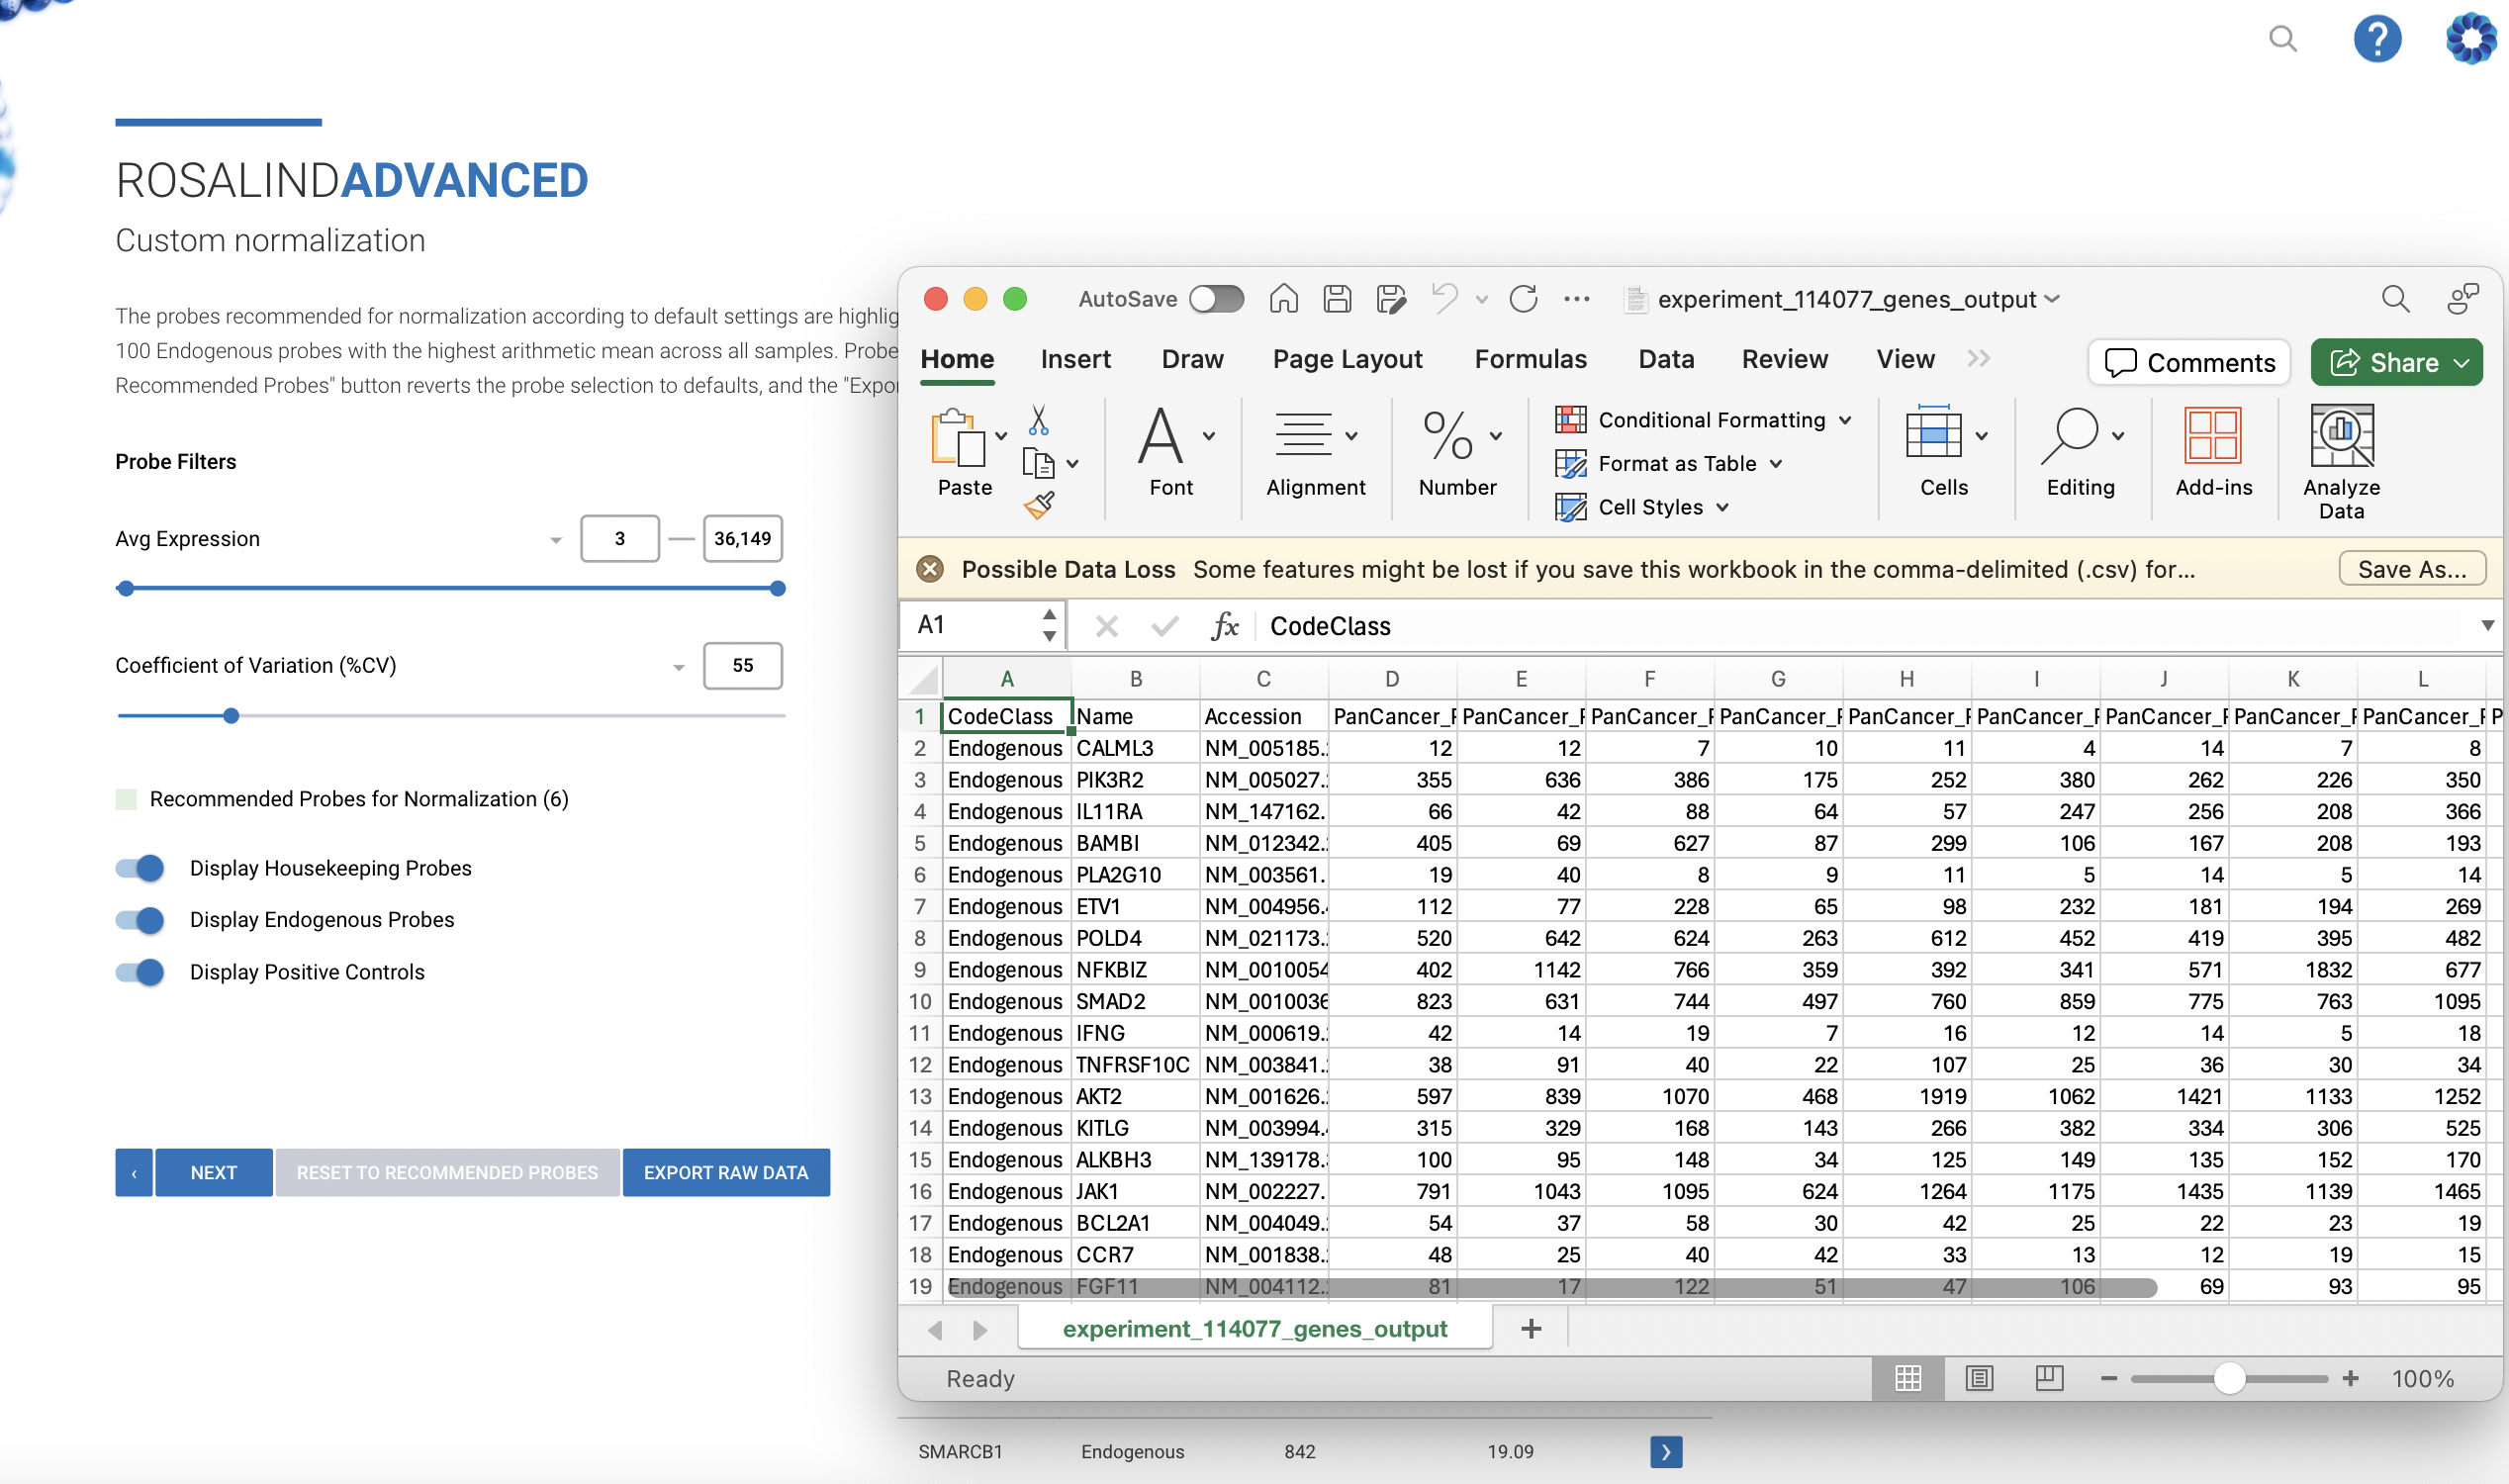
Streamline Your Normalization Processes
Ensure analytical consistency across your team with ROSALIND's export feature, designed to align your normalization process efficiently. This capability empowers researchers to share selected normalization probes, providing a foundation for uniform analysis within collaborative projects.
Perfect for teams who value the precision of synchronized normalization or require the flexibility to conduct advanced offline bioinformatics analysis. With this feature, you can easily export data, maintain consistent normalization standards, and uphold the integrity of your research, regardless of the complexity of your analytical workflows.
Rosalind Intelligence Amplify Your Panel Potential
Rosalind Intelligence goes beyond the basics to amplify the impact of your targeted gene panel. It not only increases the investment value but also enriches your research with deep, often missed connections. Shift from a narrow view to a panoramic perspective of biological interactions, as nSolver’s limitations are surpassed by Rosalind's expansive interpretation.
Harnessing the power of generative AI that’s grounded in biological truth with the Rosalind Knowledge Graph for rich and insightful Literature Reviews, produced in seconds on your target genes of interest. Explore correlations to all available nCounter data from the public repositories. Discover hidden links within your data that drive groundbreaking findings and elevate your research's impact.
Meta Analysis Mastery Harmonizing nCounter and Multi-Omics Data
Unlock the full narrative of your nCounter data by integrating with diverse multiomics layers of data. Rosalind’s meta-analysis empowers you to compare nCounter datasets with precision or to weave them into a broader multi-omics tapestry with Rosalind Intelligence to discover and interpret patterns in multi-omics expression and regulation.
This integrative approach ensures that your nCounter insights are not isolated but are considered in the context of the complex biological systems they inhabit, offering a holistic understanding that drives innovative research and serves a data mining foundation for future insight harvesting.
Collaboration Spaces offer scientists working with nCounter data a dynamic, online environment to accelerate their collaborative efforts across the lab, site to site or across continents.
With Academic, Professional, and Enterprise subscriptions, team members are instantly connected to completely visualized datasets with full pathway interpretation and complete analysis tools, so any team member can explore, re-analyze, add new cut-offs and comparisons and even setup new meta-analyses across datasets. This greatly extends beyond the basic sharing of Starter subscriptions, enabling a more comprehensive sharing and analysis experience.
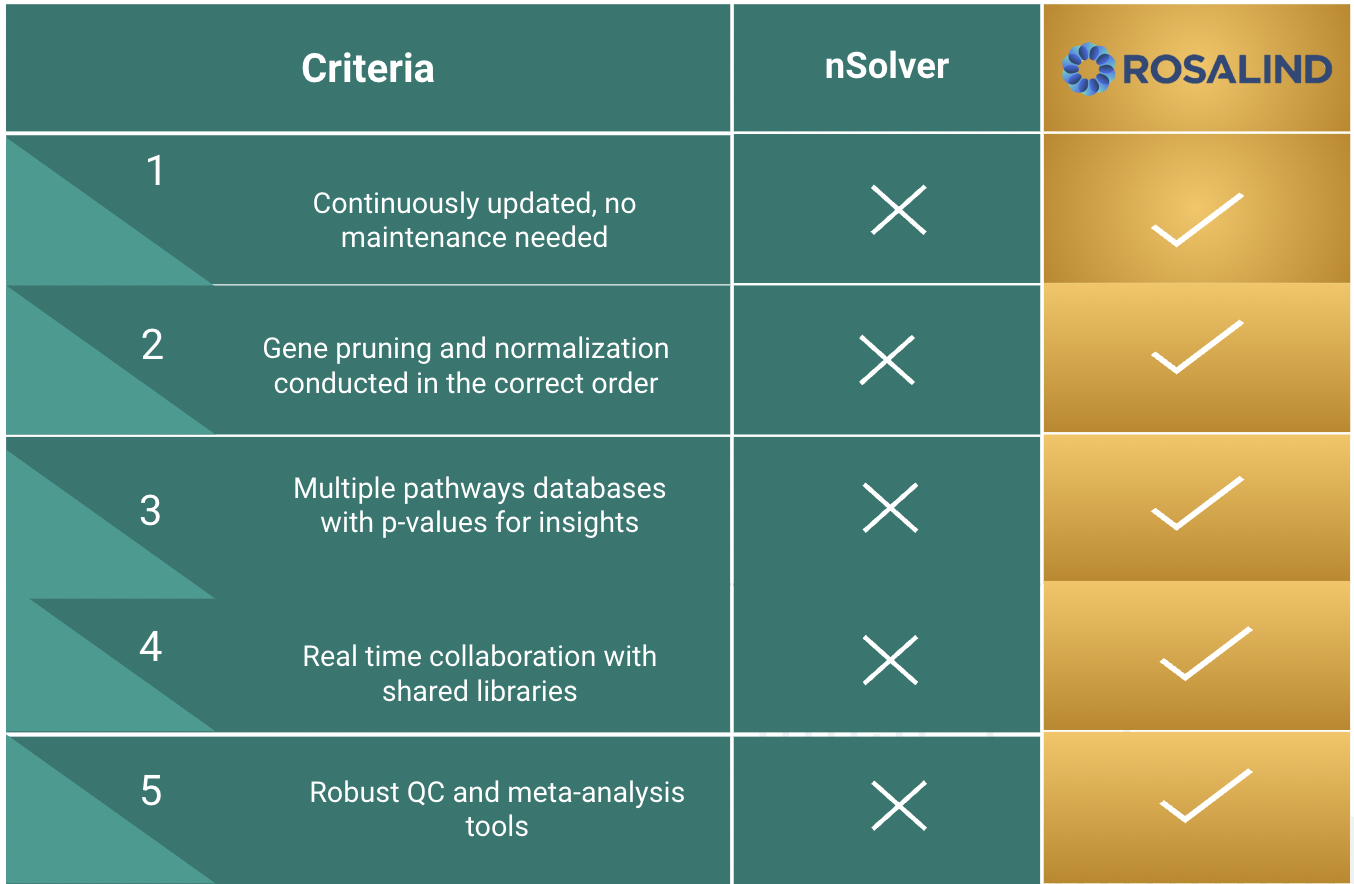
Far Superior Than other offerings
When it comes to advanced data analysis, Rosalind offers a comprehensive solution that nSolver cannot match. Rosalind is continuously updated with no maintenance required, ensuring you always have access to the latest features. It also ensures gene pruning and normalization are done in the correct sequence, providing more reliable insights. With multiple pathways databases and p-value support, Rosalind delivers deeper analysis, while its real-time collaboration tools and shared libraries make teamwork seamless. Additionally, Rosalind offers robust QC and meta-analysis tools to ensure high-quality results every time.
Expert Guidance In-Depth nCounter Knowledge
With a team of specialists whose expertise eclipses the basic support offered elsewhere, Rosalind provides an unmatched level of nCounter knowledge. Our dedicated experts, well-versed in the nuances of nCounter technology, remain ahead of the curve, focusing on your needs while NanoString continues to innovate the platforms of tomorrow. Partner with us for industry-leading insights and support that's as advanced as your research.
Coupled with the domain expertise of our PhD-level Customer Success team, Rosalind delivers a symbiosis of technical acuity and deep scientific understanding. This dual approach ensures that your nCounter analysis is not only technically sound but also strategically aligned with the nuances of your research domain.
NanoString Advanced Data Analysis
Upgrade to unlock the new Advanced Data Analysis for nCounter and GeoMx: Custom Normalization, Low Expressor Pruning, Cell Type Profiling.