Bulk RNA-seq Gene Expression
DIY Bioinformatics for this genomics staple
NanoString GeoMx Spatial Transcriptomics
The recommended and preferred solution for best-in-class GeoMx data analysis
NanoString nCounter Gene and miRNA Expression
Bruker's recommended and preferred solution for best-in-class nCounter data analysis
Single Cell Gene Expression
From FASTQ to cell clusters and beyond
Gene Regulation & Anti-Sense: Small RNA-seq
Small RNA-seq data analysis designed for the biologist
Histone Mark & Transcription Factor: ChIP-seq
Comprehensive ChIP-seq data analysis
Chromatin Accessibility: ATAC-Seq
Genome-wide chromatin accessibility analysis
Sharing & Collaboration
Accelerate teamwork anywhere in the world
Knowledge Graph and Search
Data organized for semantic queries
COVID-19 Diagnostic Monitoring System
SARS-CoV-2 Viral Mutation Tracking
COVID Research Community
Global research analyzing COVID-19 genomic datasets
Immuno Oncology
Making discoveries on IO research
Breast Cancer
Identifying differentially expressed miRNAs in breast cancer
HIV
Transcriptional and genomic profiling study of HIV+ DLBCL
Diabetes
Discover and accelerate T1D
Multi-Omics Dataset
Explore multi-omics datasets in epigenetics research
Single Cell Data
Explore datasets with our Cell Ranger graph-based clustering
nanoString Gene Expression
Analyze your nCounter data in minutes
nanoString Mouse Glial Profiling Panel
Explore neuroinflammatory astrocyte subtypes in the mouse brain
RNA-Seq Data
Get started with bulk RNA-Seq data
Pharma, Biotech, and Academic Researchers
Learn about Enterprise, Professional, and Academic subscriptions
Service Providers
Learn about Service Provider, Contract Research Organization (CRO), and Academic Core Lab licenses
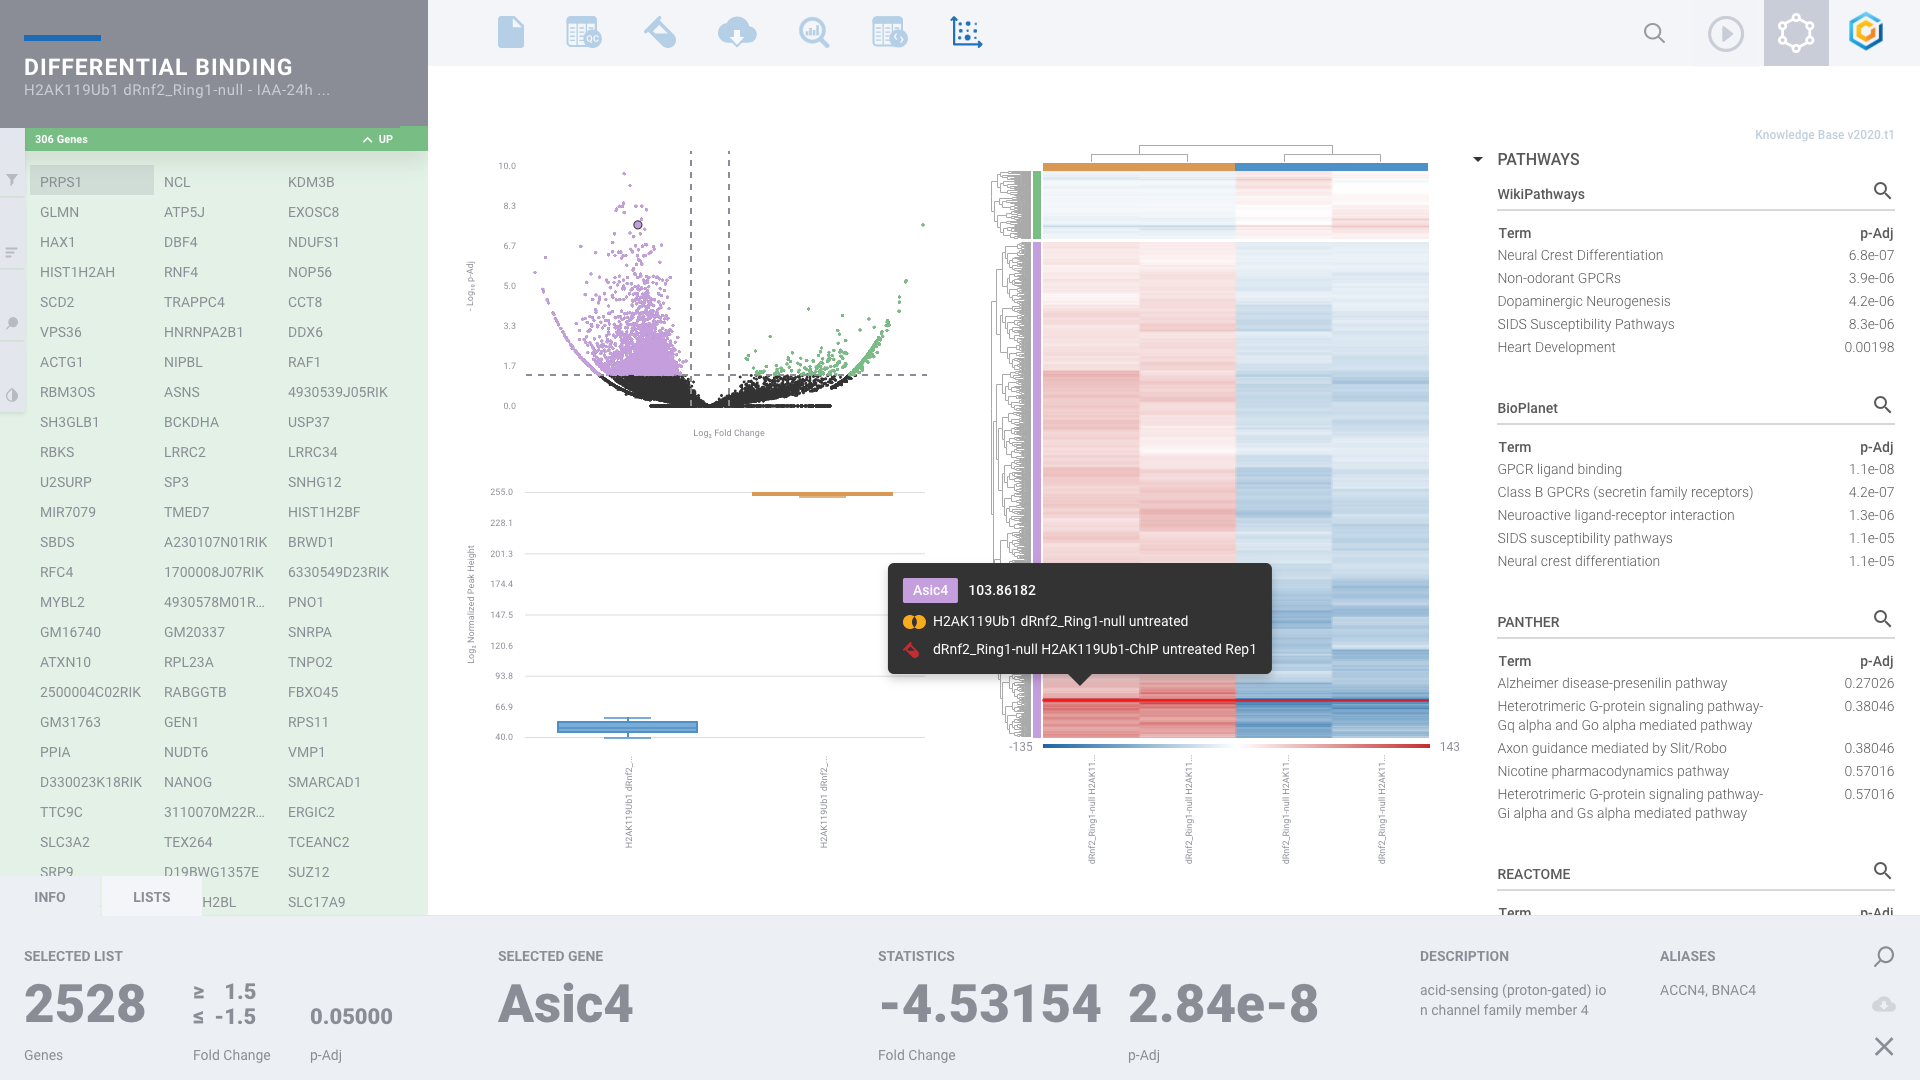
Seamlessly sift and sort through differential protein binding and histone marks on gene promoters and see the pathways associated. Change cut-offs with new filters. Validate gene signatures and discover new signatures.
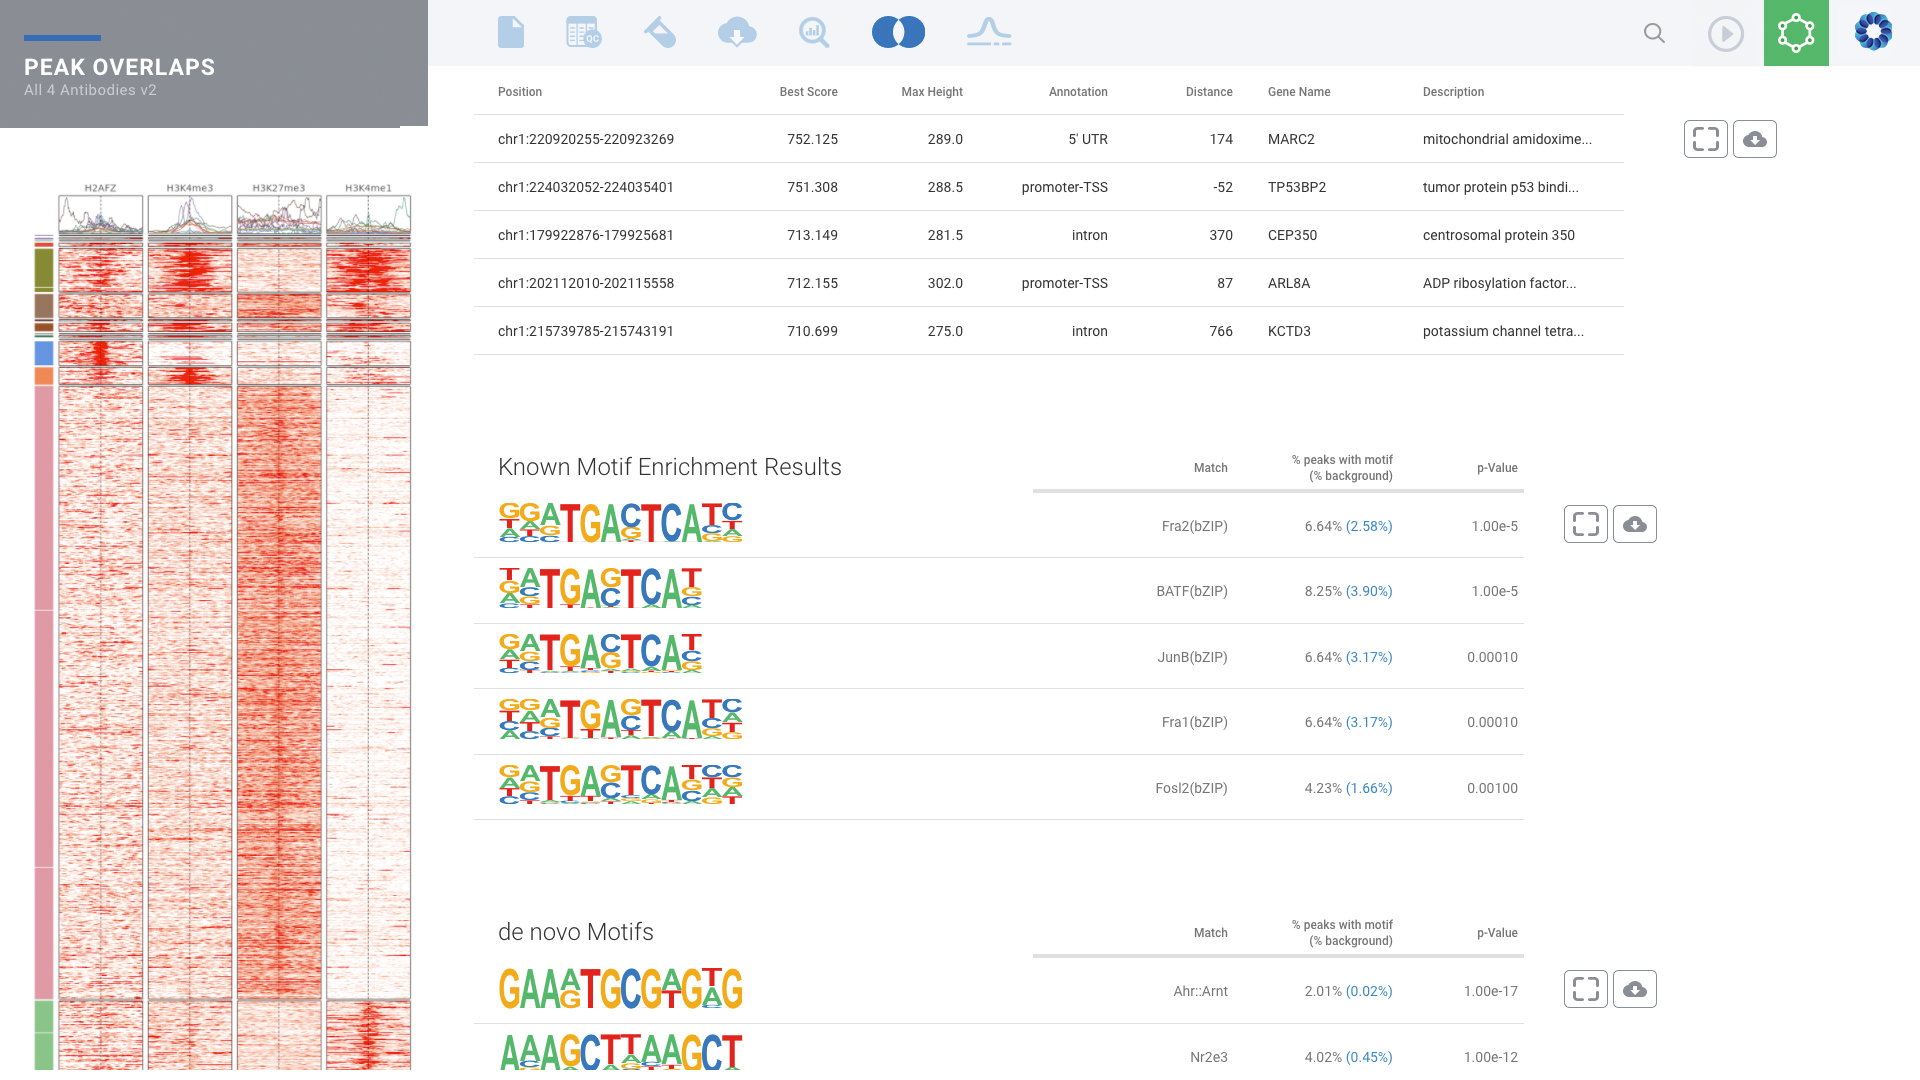
Using the Peak Overlap interactive analysis, identify unique and overlapping protein binding or histone marks regions across samples and comparison groups. Select your samples intersections based on the Venn diagram and explore the most significant protein binding regions in the annotated table. Select a meta-analysis to begin exploring your results.
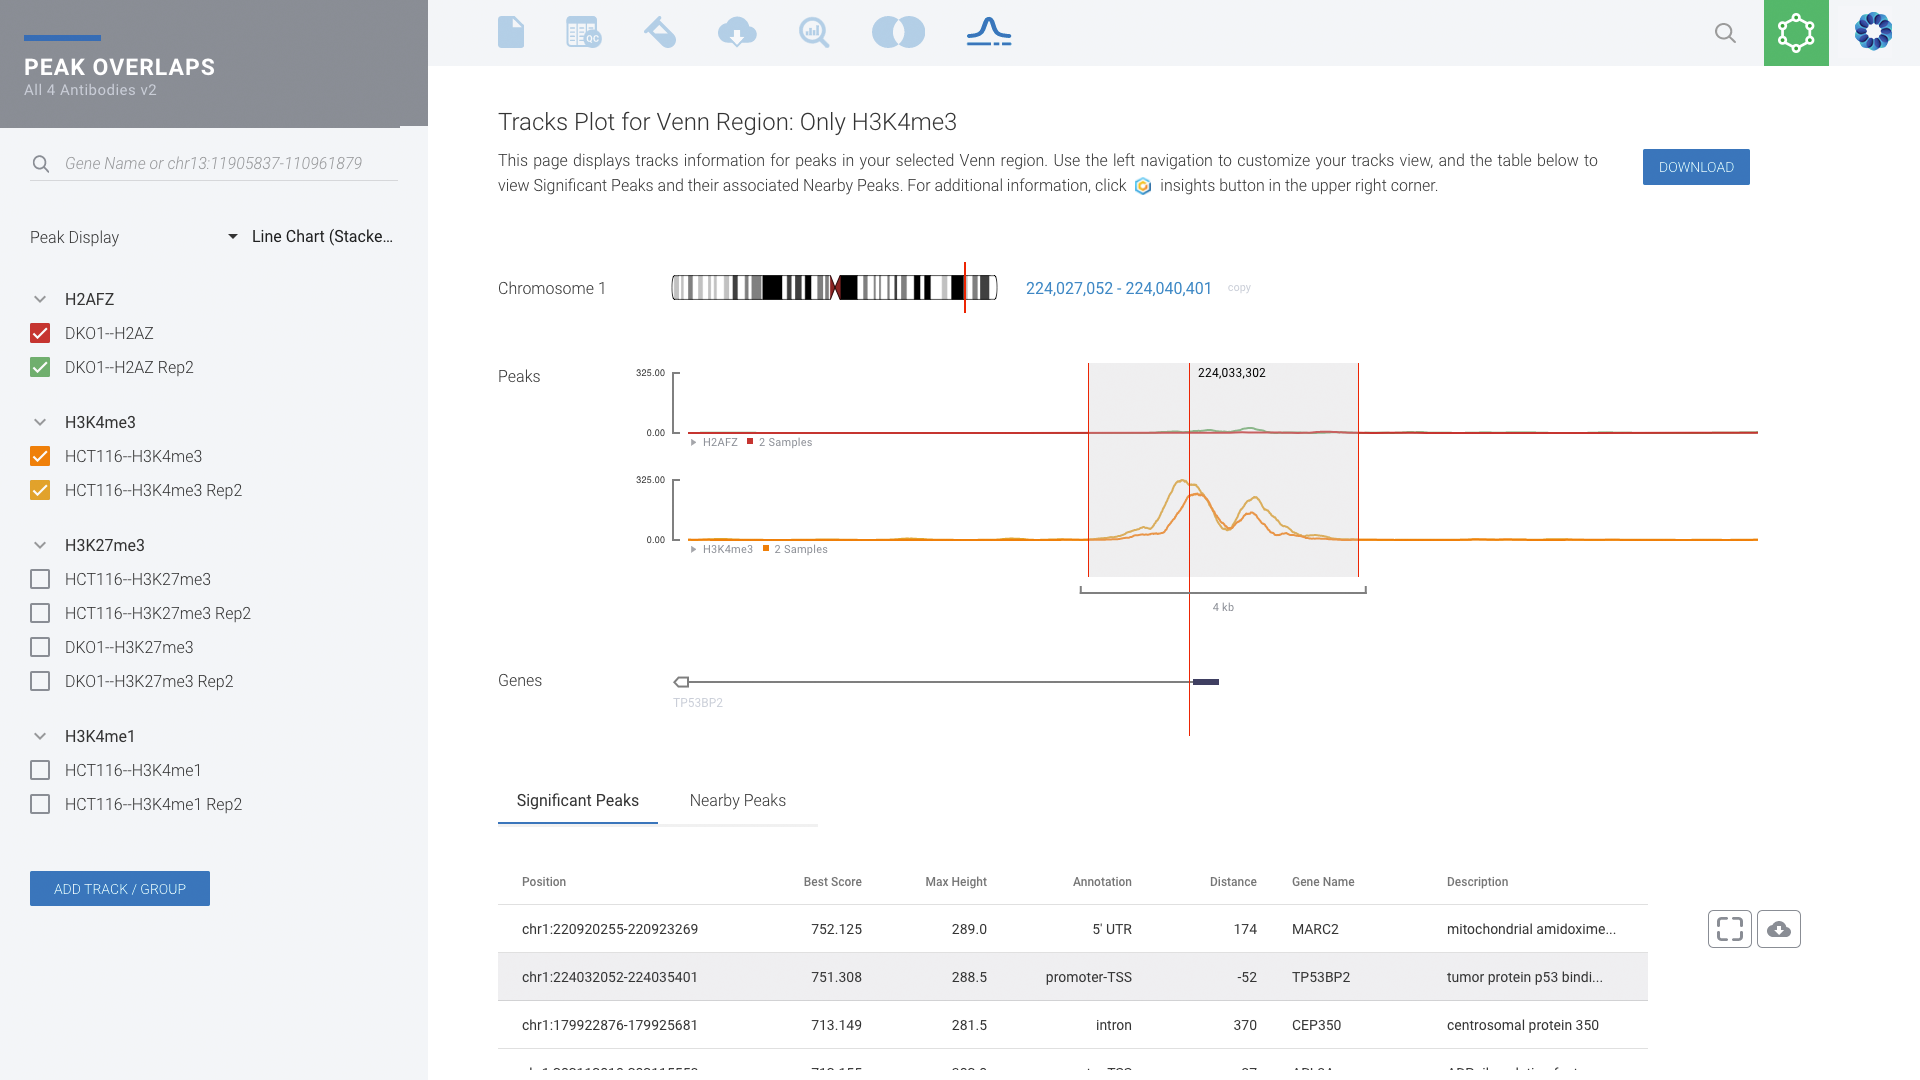
Locate areas across samples using the integrated genome browser as the gene models annotations. Save the time, complexity and the inconvenience of exporting your data to UCSC or IG. ROSALIND users can search by gene or chromosomal location and organize samples by groups and select which tracks to display.
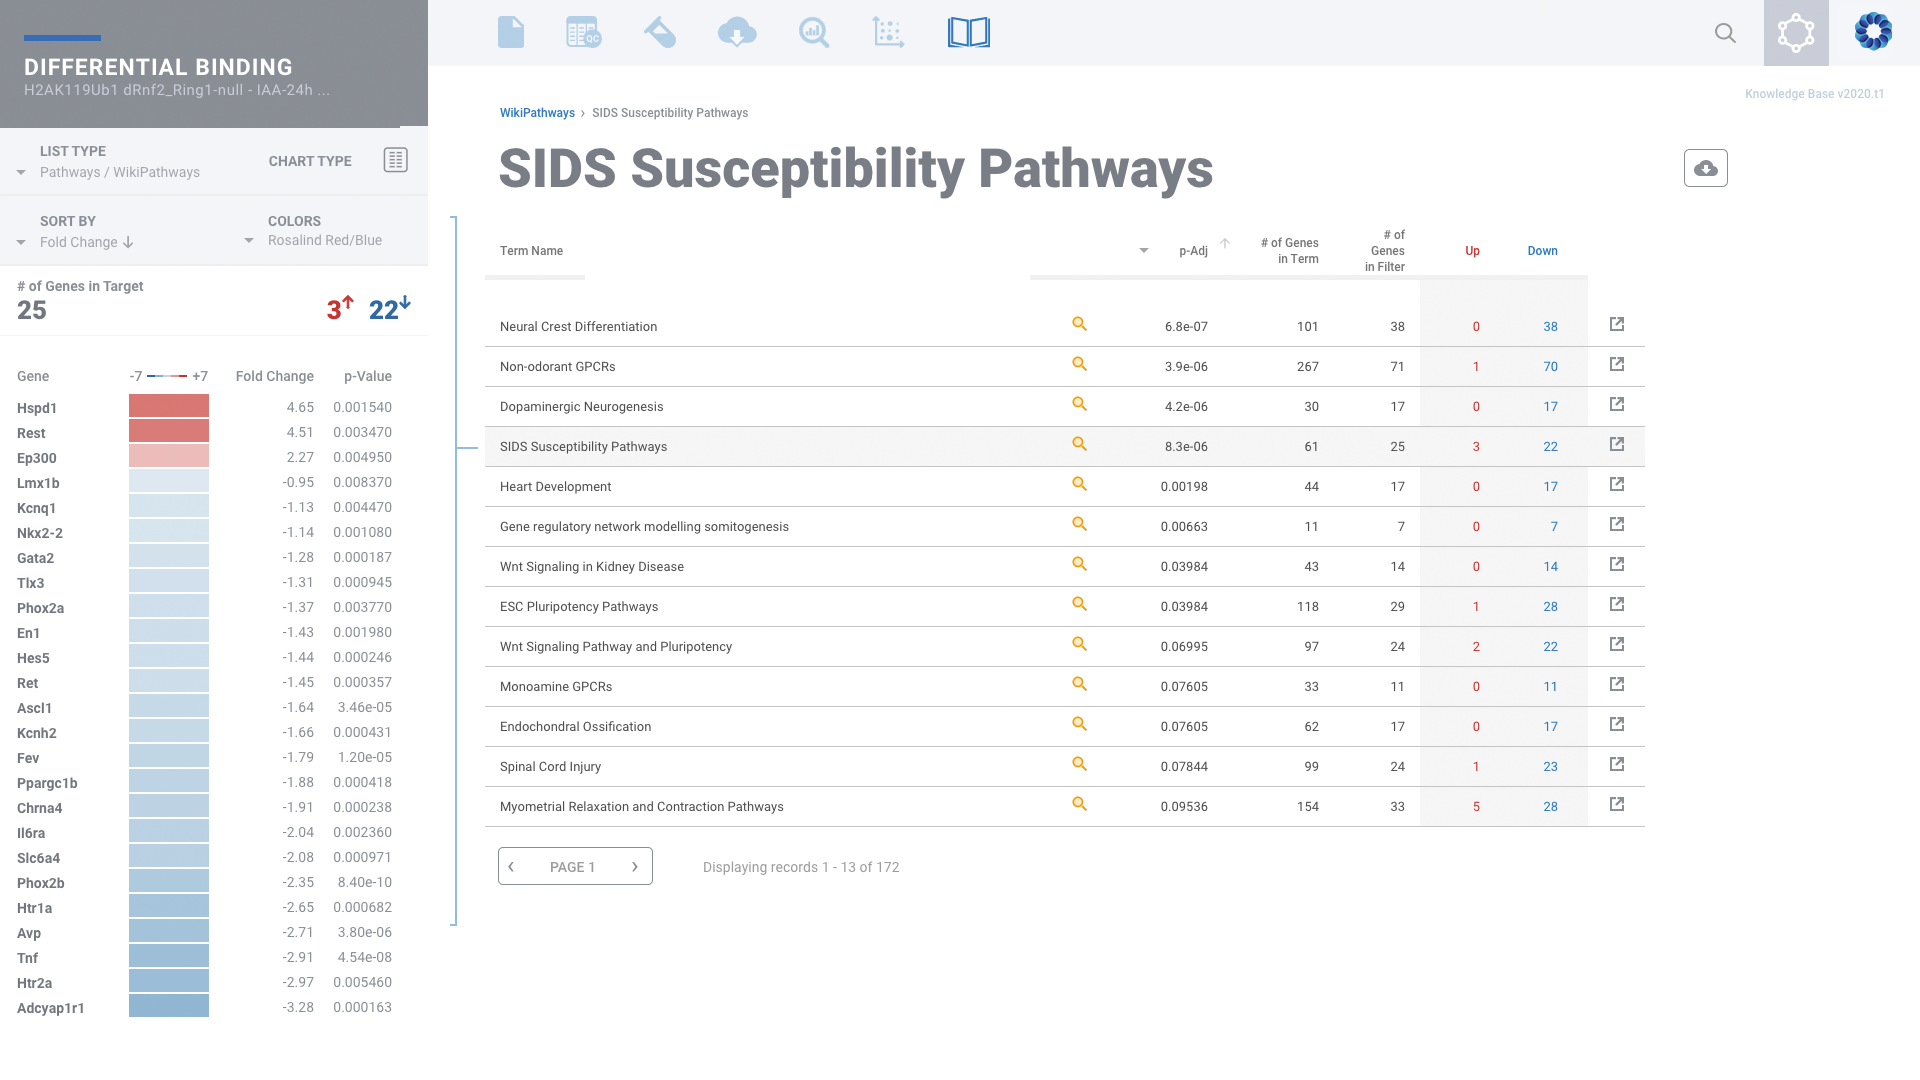
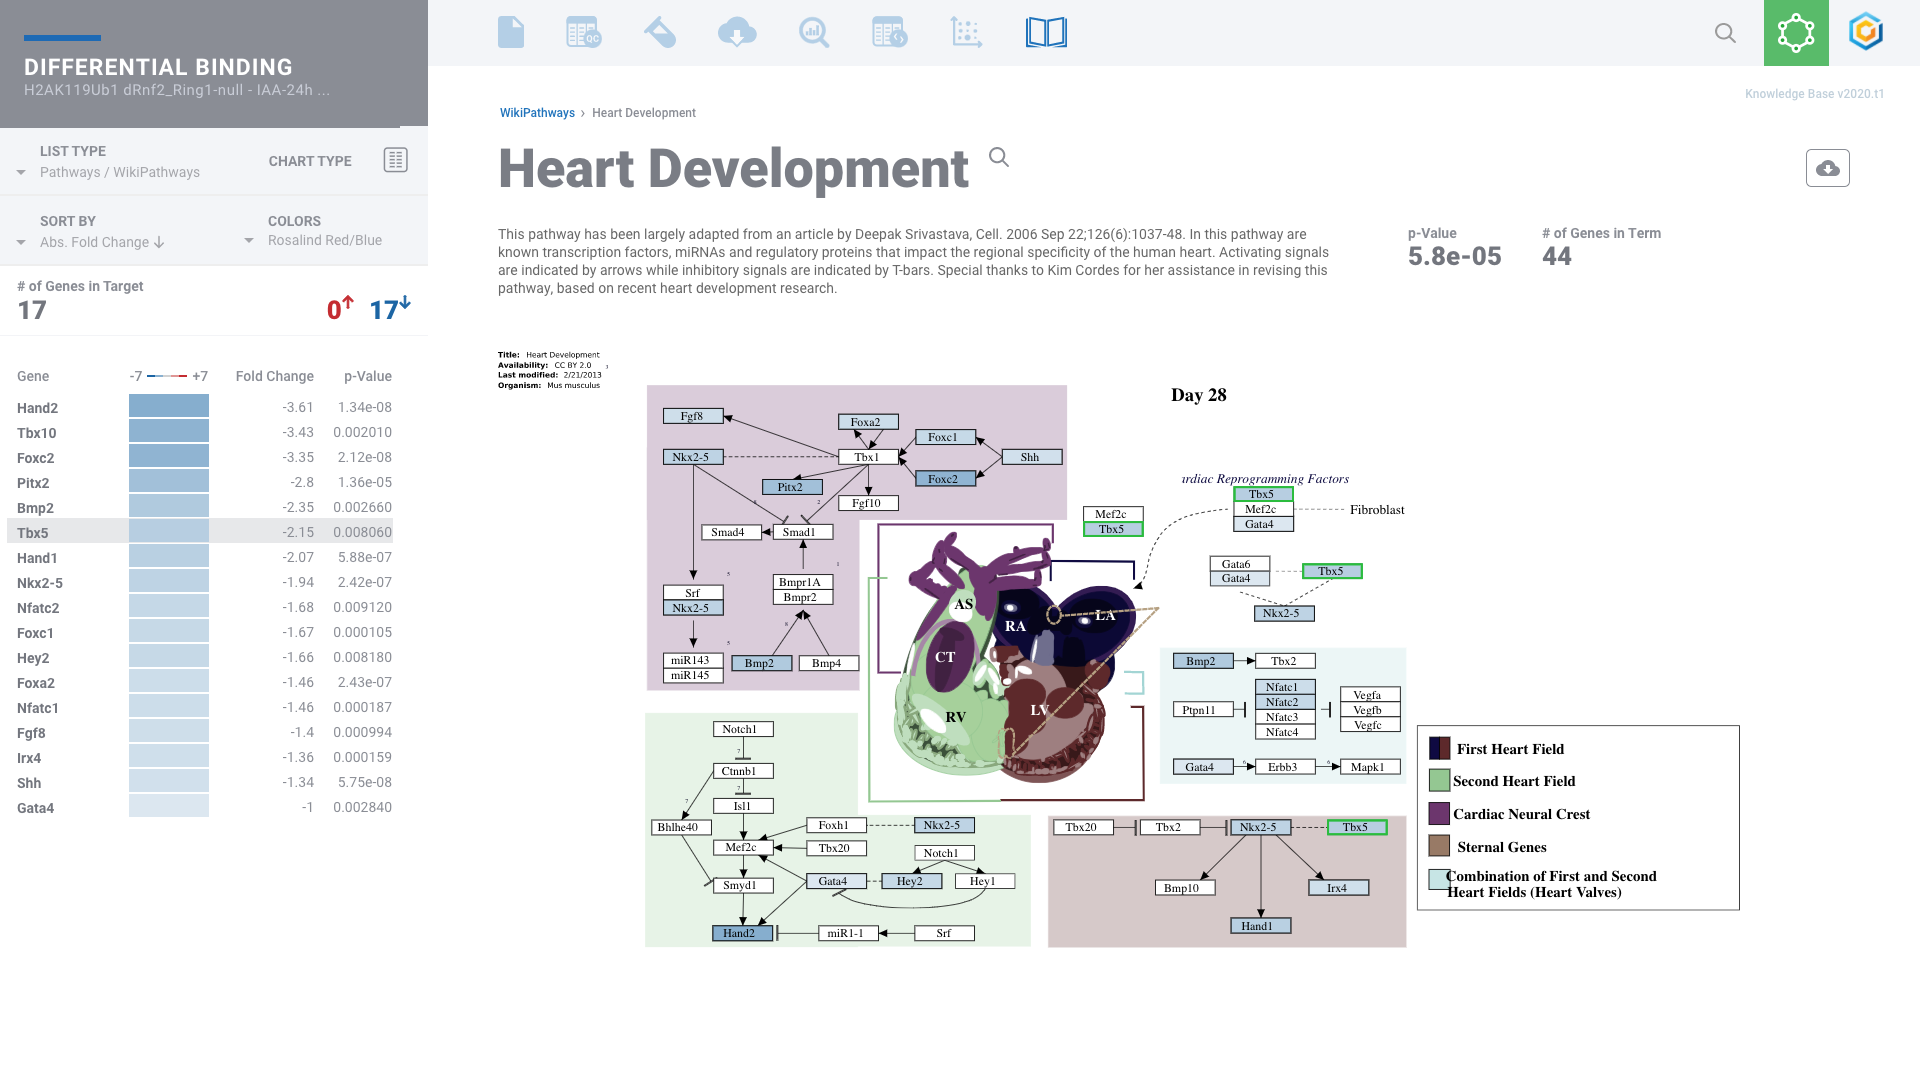
Review the significant pathways associated with genes exhibiting protein binding and histone marks on their proximal promoters.
Access pathway diagrams with detailed descriptions, protein binding and histone marks changes. Interact with pathway diagrams & gene lists to see corresponding genes highlighted in the pathway diagram.
Interested in ROSALIND for ChIP-Seq Analysis?