


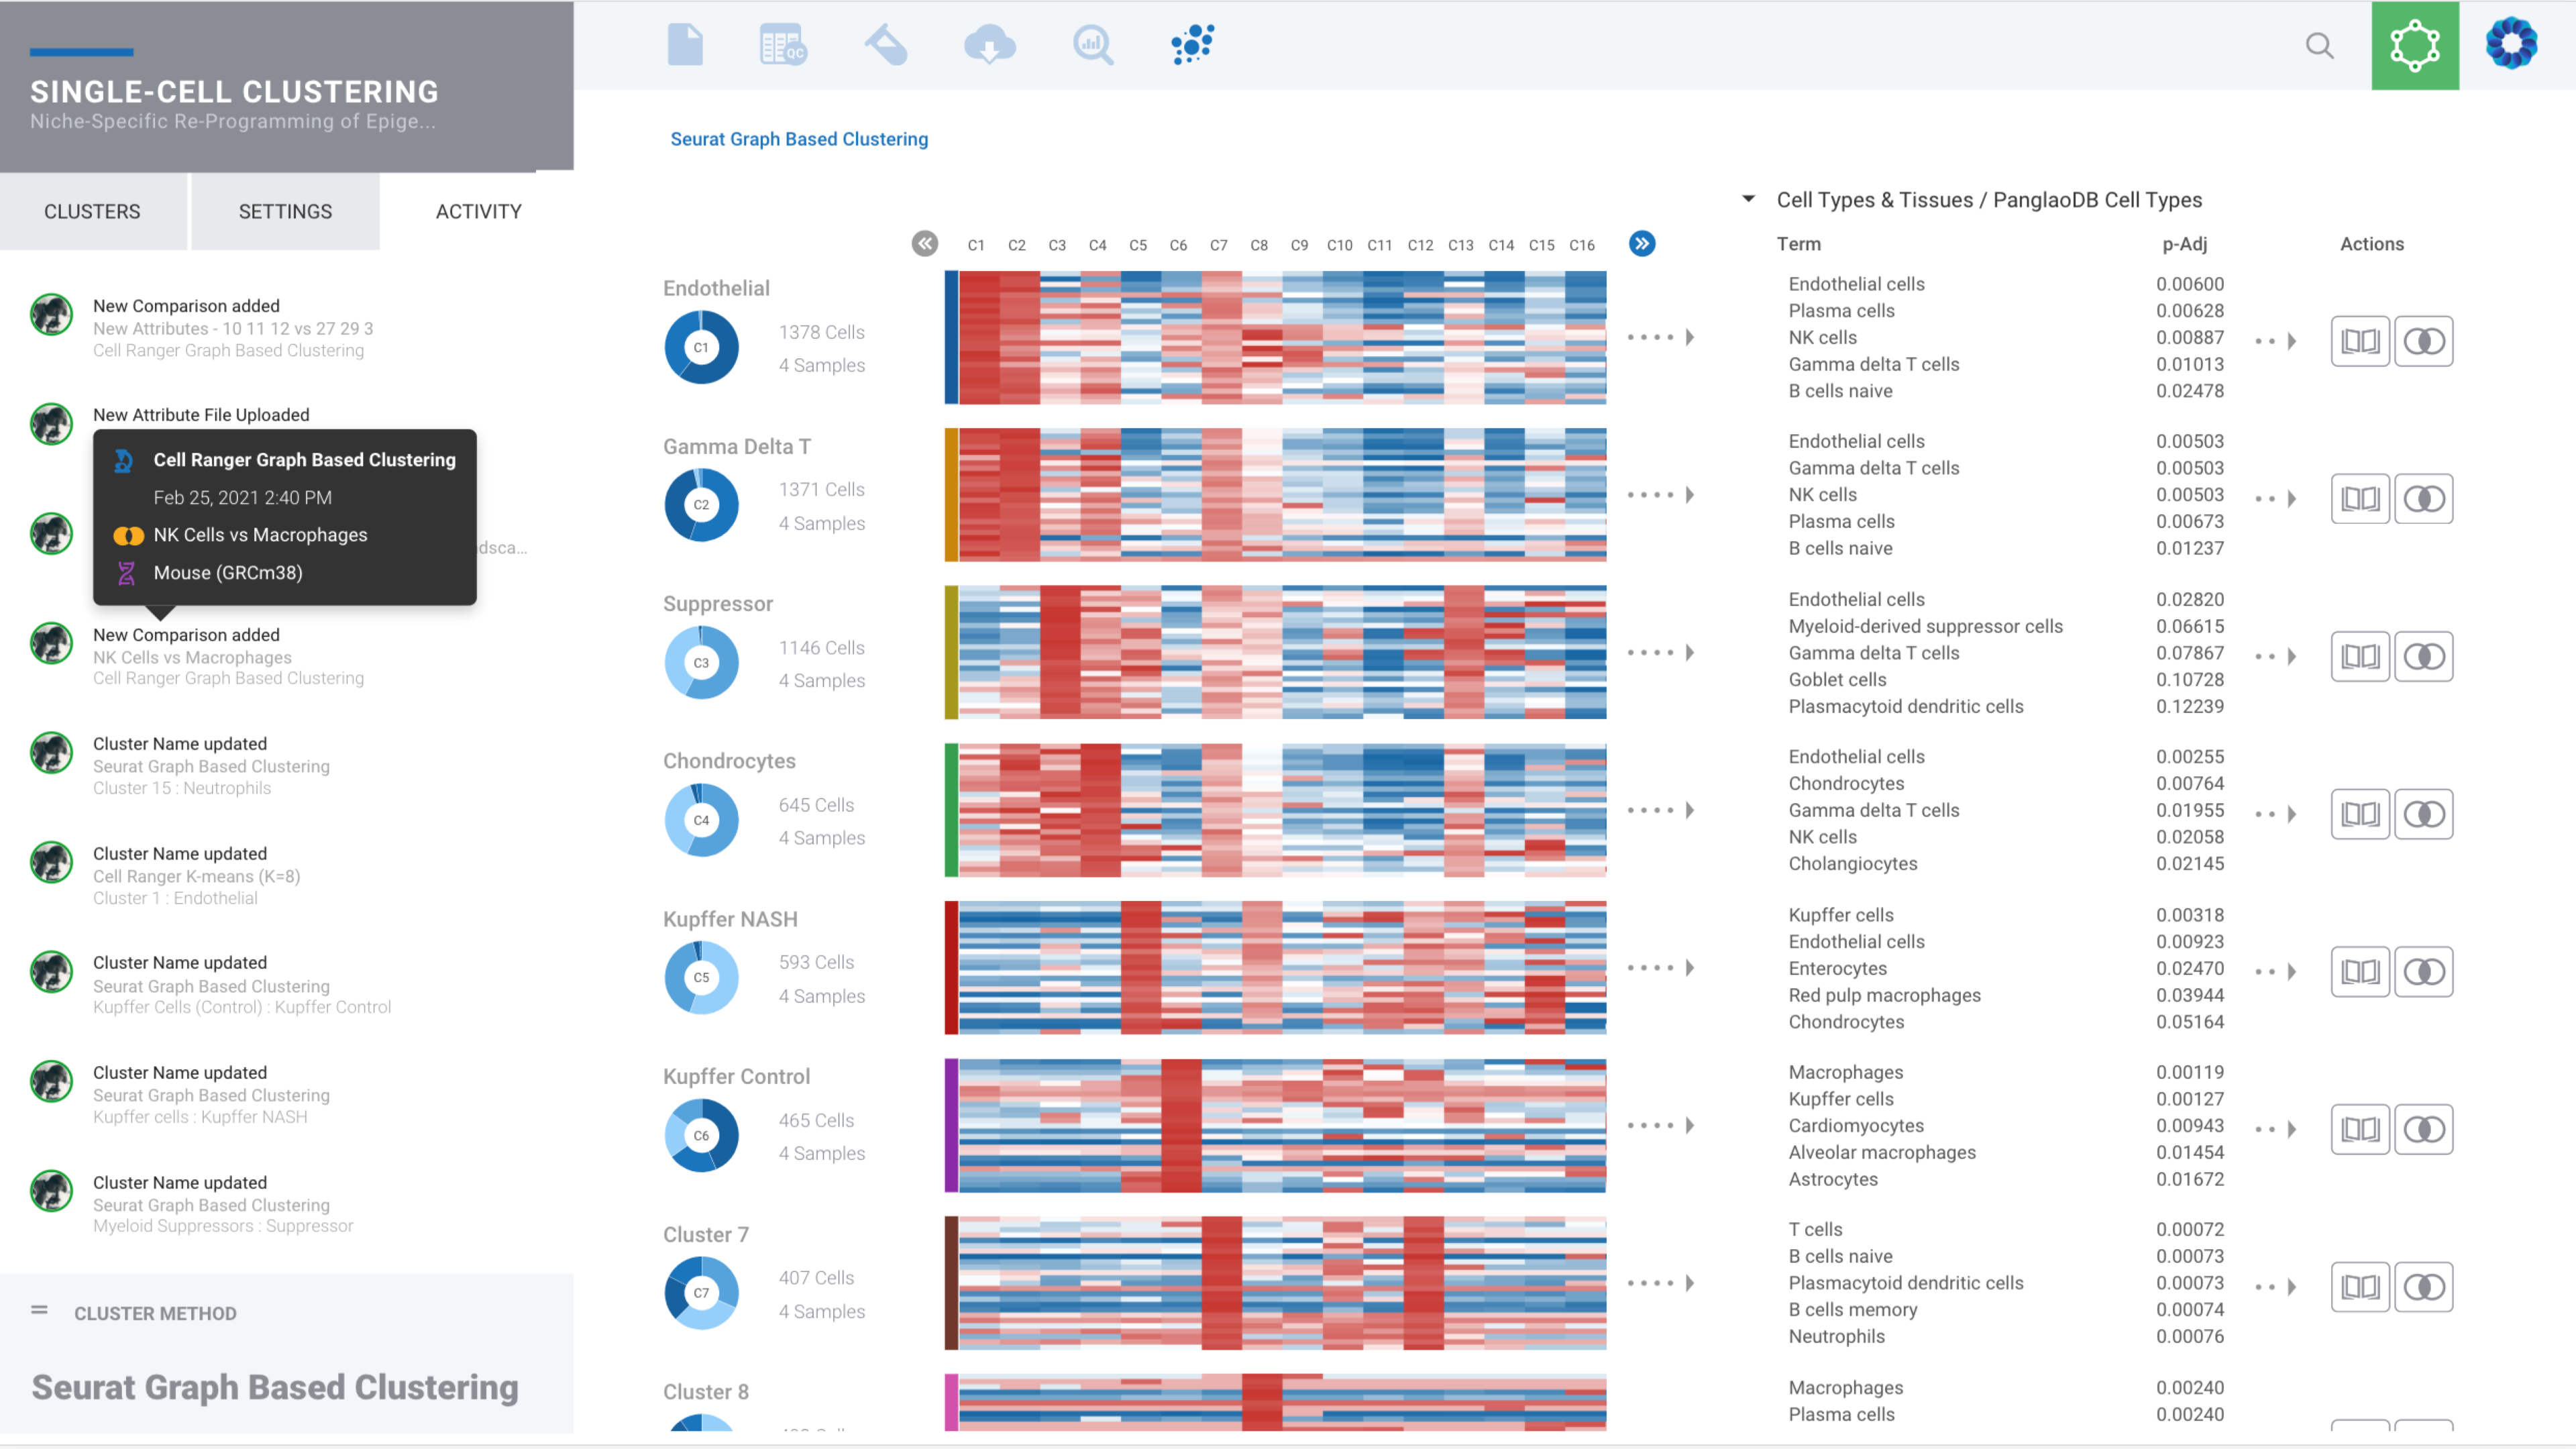
ROSALIND intelligently gathers relevant knowledge to help you best identify & annotate cell types. Notes are securely maintained across cluster methods, so you can capture observations in any context without losing a beat.


Dive deeper into single cell clusters to explore gene expression using violin plots and interactive T-SNE and UMAP projections. Define cluster comparisons to see differentially expressed genes & pathway interpretation.
Analyzing your data is only half the battle. Getting the right plot and image to communicate your findings makes all the difference. ROSALIND simplifies single cell data visualization giving you the plots you need with the controls to adjust fonts, plot sizes, zoom into clusters, hide legends, and see results across all samples.

Accelerate your single cell interpretation by collaborating in real-time with colleagues across the globe. Graph-accelerated knowledge bases identify cell types and assist users in annotating cell clusters. Seamlessly share analyzed data, annotations, and lists of genes of interest.
Enjoy the thrill of seeing your differential expression results come to life as dynamic, interconnected plots and diagrams with gene lists, heatmaps, volcano & MA plots, and advanced covariate correction.


Discover more and save on valuable resources since no additional tools are required when using the integrated pathway interpretation provided by the ROSALIND Knowledge Graph and integrated biomedical knowledge bases. Explore interactive pathway diagrams with detailed term descriptions, annotated fold-change colors, and gene heatmaps.
ROSALIND Meta-Analysis combines multi-omics datasets and uses unsupervised machine learning coupled with our advanced Knowledge Graph to intelligently uncover and interpret gene signatures.

Interested in ROSALIND for Single Cell Analysis?


 Learn More