Single Cell - See More Features

Empowering scientists to get more out of their Single Cell data & complete projects faster

SLIDE

Reimagining single cell analysis from import to interpretation as an intuitive web experience

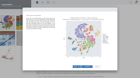
ROSALIND transforms the analysis of Single Cell RNA-Seq with an end-to-end web-based experience for analysis, interpretation and collaboration. Interactive analyses of single cell clusters reveals biology of cells.

Automated clustering provides Seurat methods, so you can choose the clustering that fits best

Assisted cell type identification saves time with integrated knowledge bases

Dynamic plots interactively display T-SNE, U-Map, Bar Charts, Donuts and Heatmaps to explore single cell trends

Native collaboration capabilities facilitate data sharing and teamwork

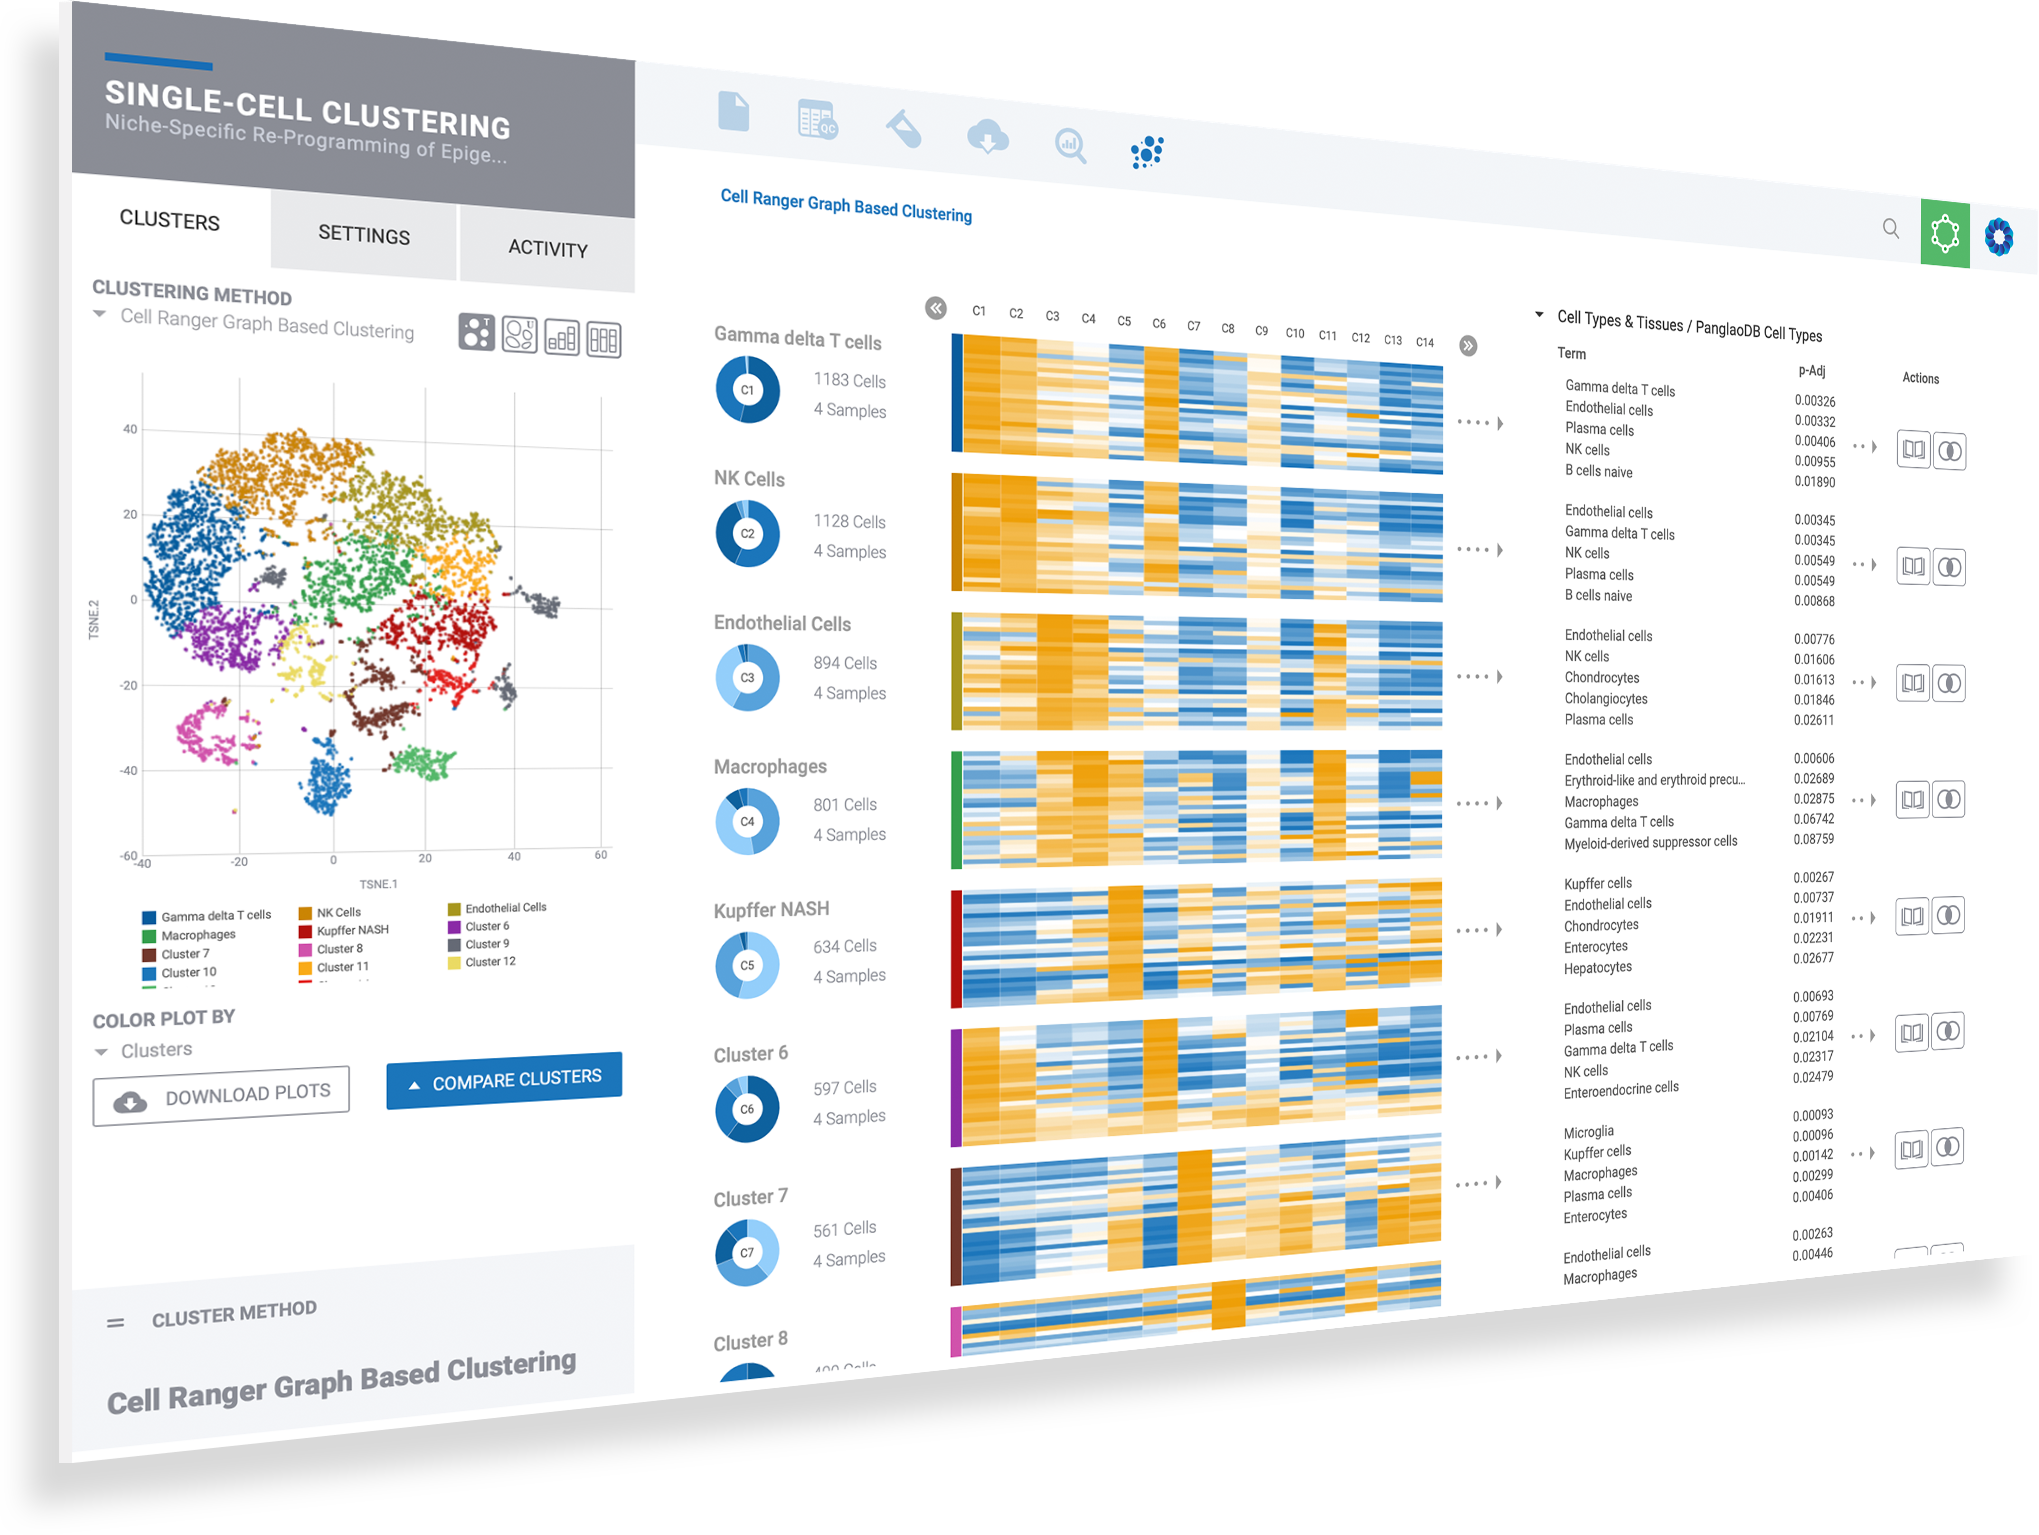
Annotate single cell data seamlessly & interactively

ROSALIND intelligently gathers relevant knowledge to help you best identify & annotate cell types. Notes are securely maintained across cluster methods, so you can capture observations in any context without losing a beat.

Select clusters to see heatmaps with marker genes

Toggle dynamic plots to see cells by sample, or cluster

Adjust settings to see 10, 25 or 50 marker genes, change colors or customize plots

Mouse over donut plots to see sample mix & cell counts

Click on Cell Types to explore knowledge base results for assisted identification

Use mouse gestures or scrolling on the T-SNE & UMAP to zoom and pan across the plot

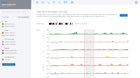
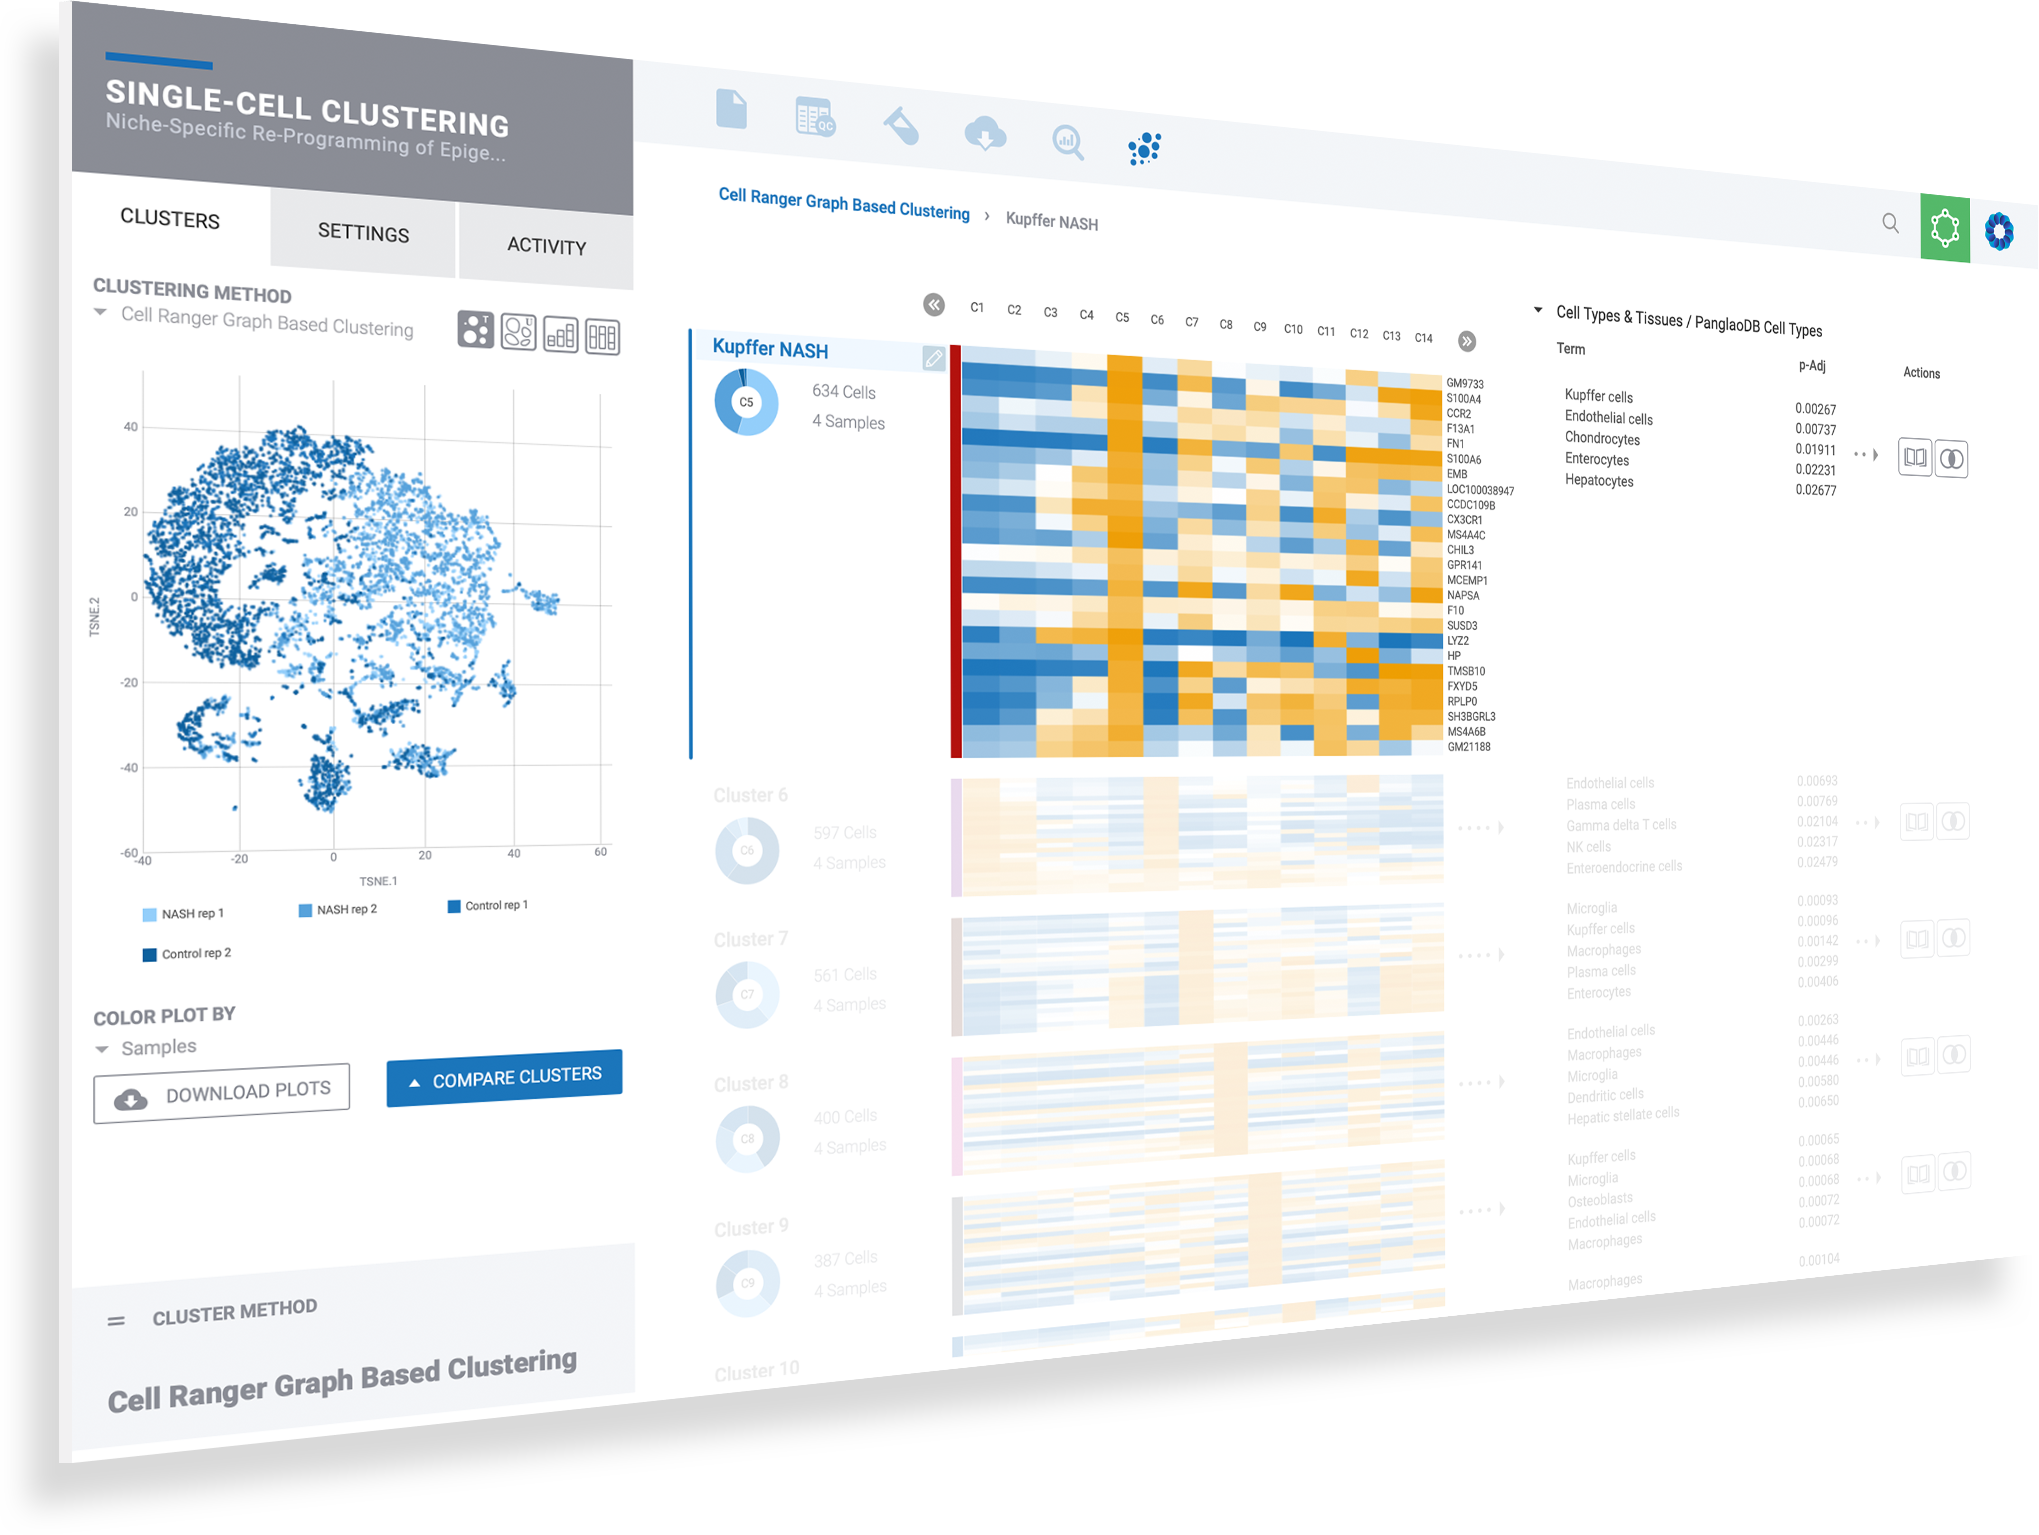
Visualize expression of marker genes & setup comparisons across any combination of clusters

Dive deeper into single cell clusters to explore gene expression using violin plots and interactive T-SNE and UMAP projections. Define cluster comparisons to see differentially expressed genes & pathway interpretation.

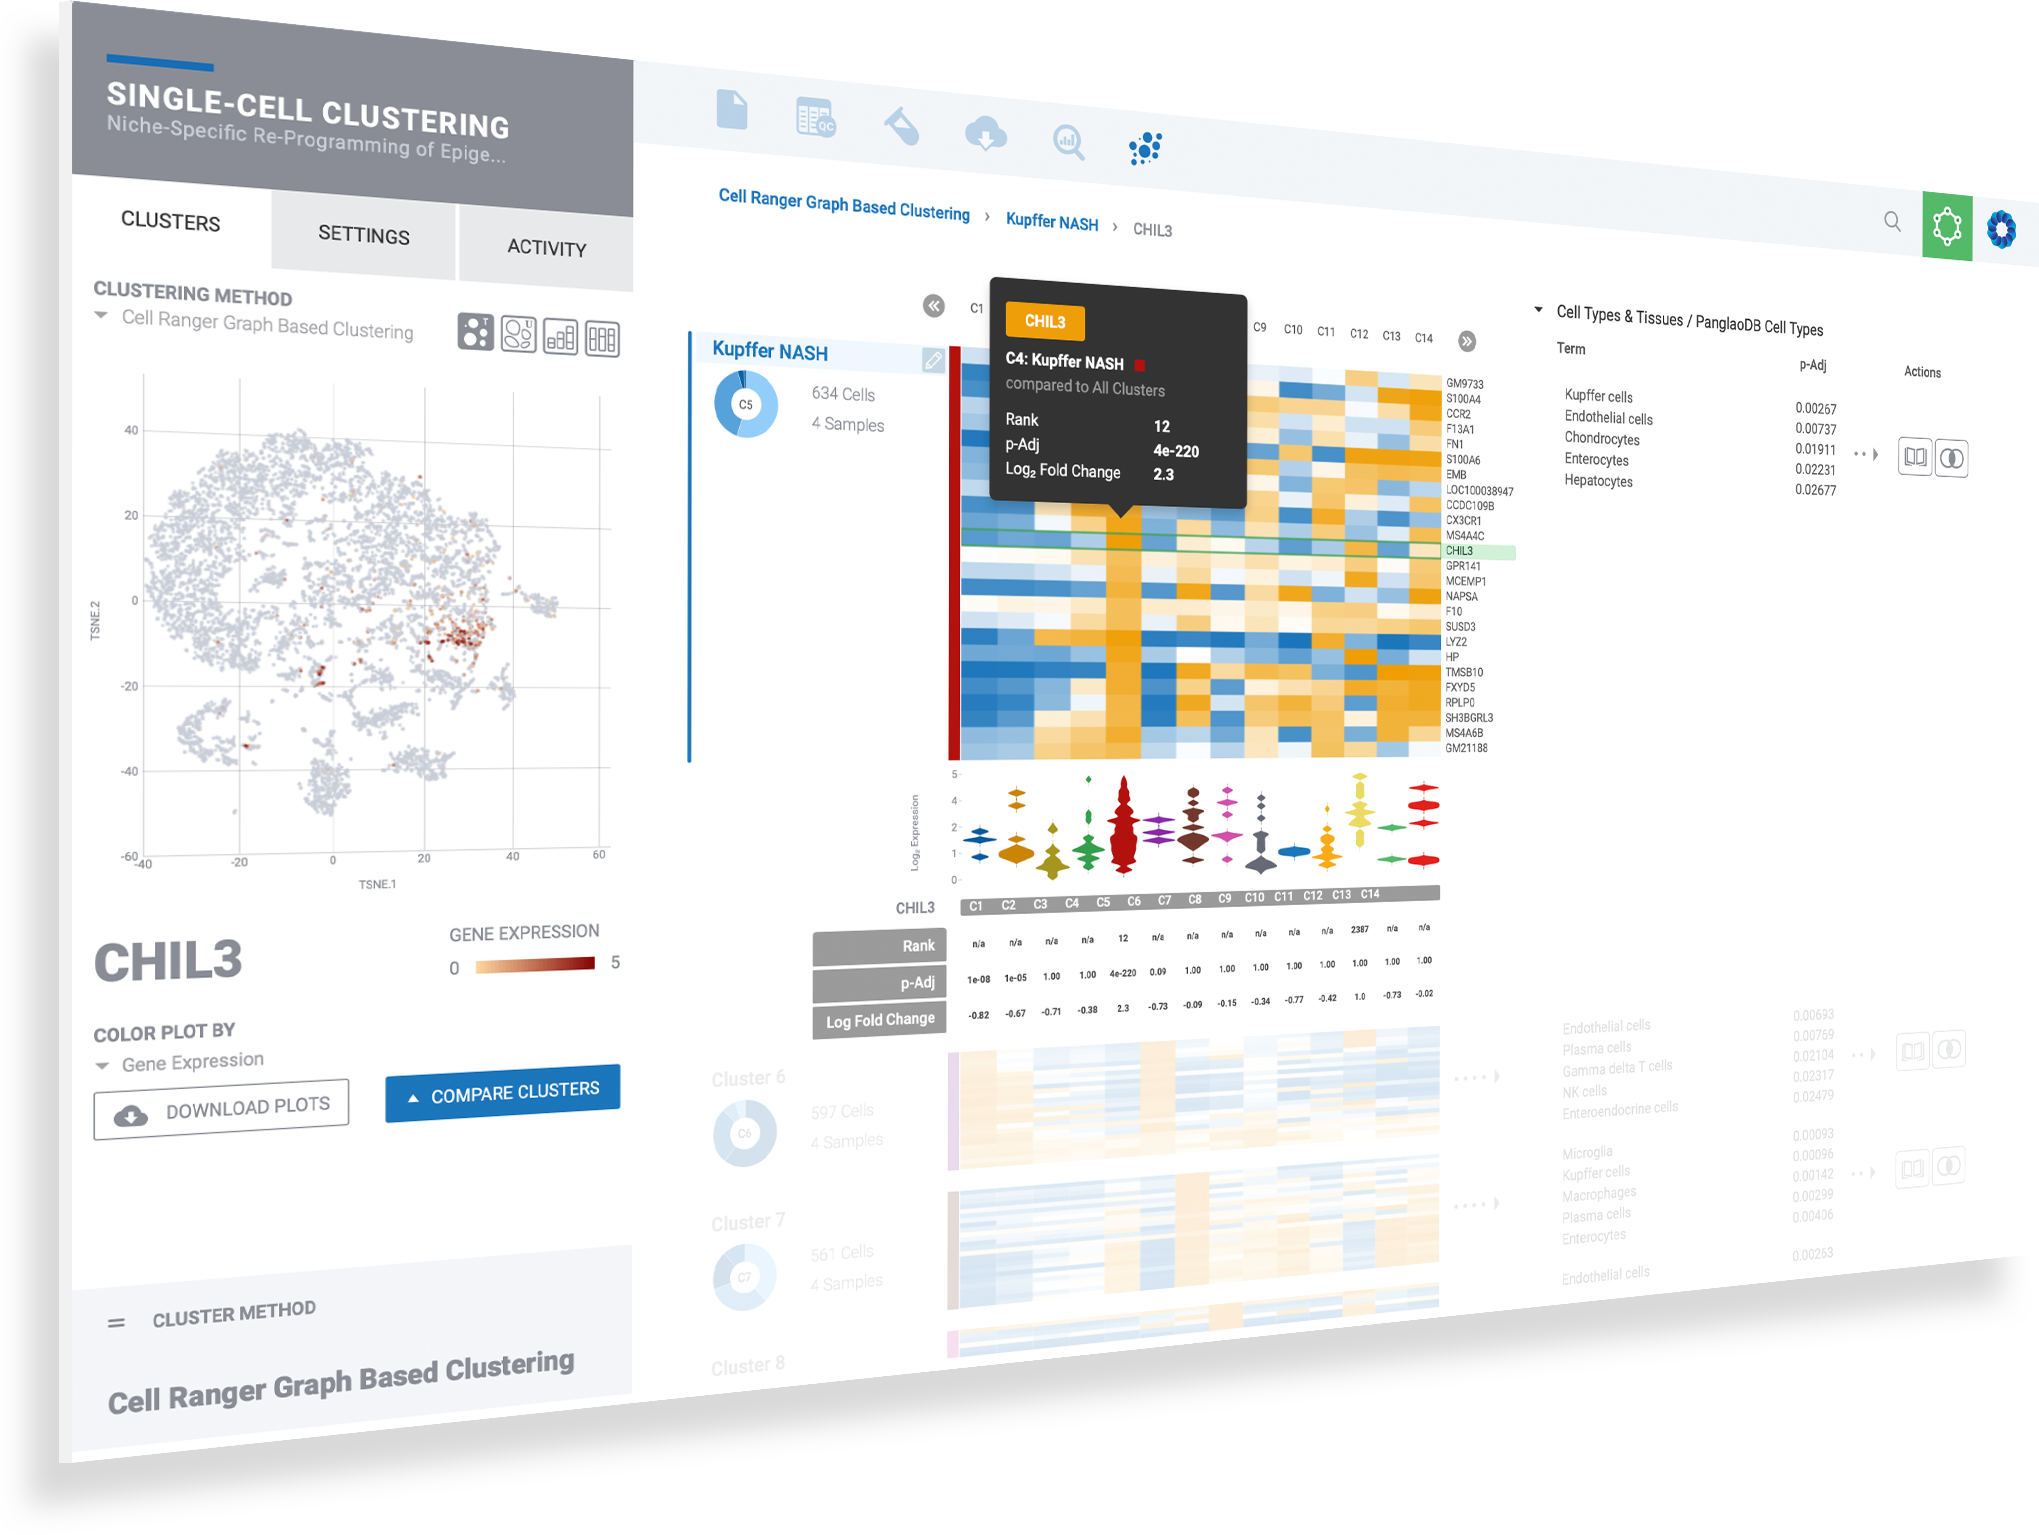
Immersive information on every data point helps to guide scientific inquiry

Select any gene to instantly visualize expression across every cluster

Create new comparisons by selecting desired cell clusters

Perform comparisons for any clustering method to see results from Seurat clustering, independently

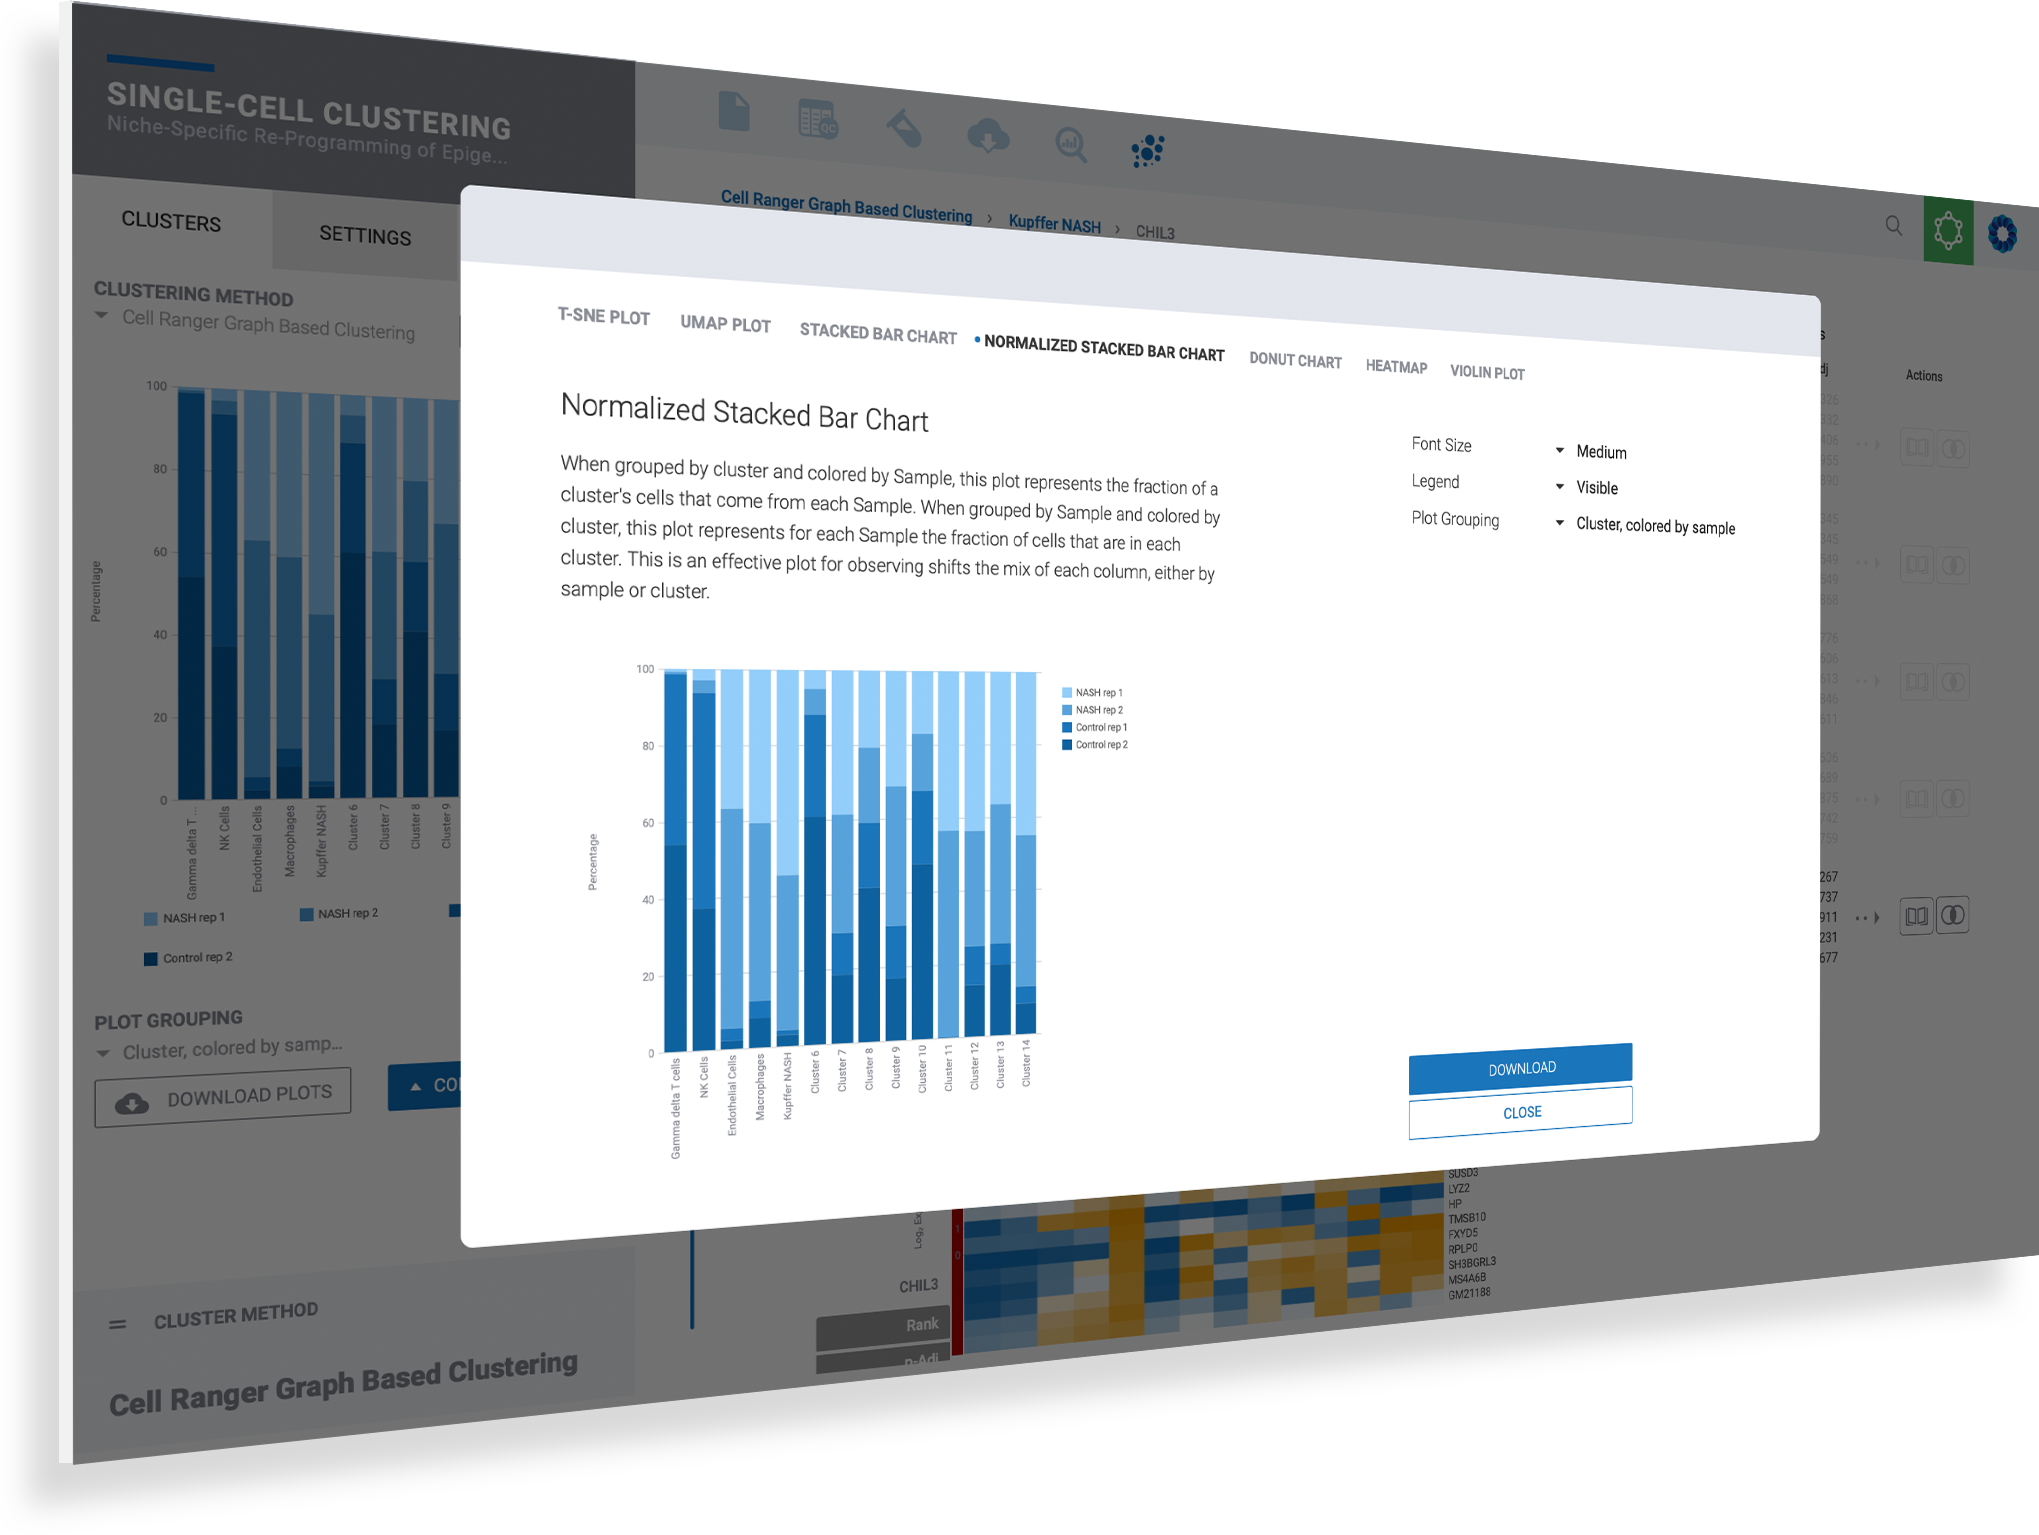
Customize and download any plot for presentation with publication-ready figures

Analyzing your data is only half the battle. Getting the right plot and image to communicate your findings makes all the difference. ROSALIND simplifies single cell data visualization giving you the plots you need with the controls to adjust fonts, plot sizes, zoom into clusters, hide legends, and see results across all samples.

Customize each plot based on the context of your data to see genes, clusters, or samples

Use the navigation menu in the enhanced plot control center to toggle plot types

Fine-tune your plots using the options provided uniquely for each plot type

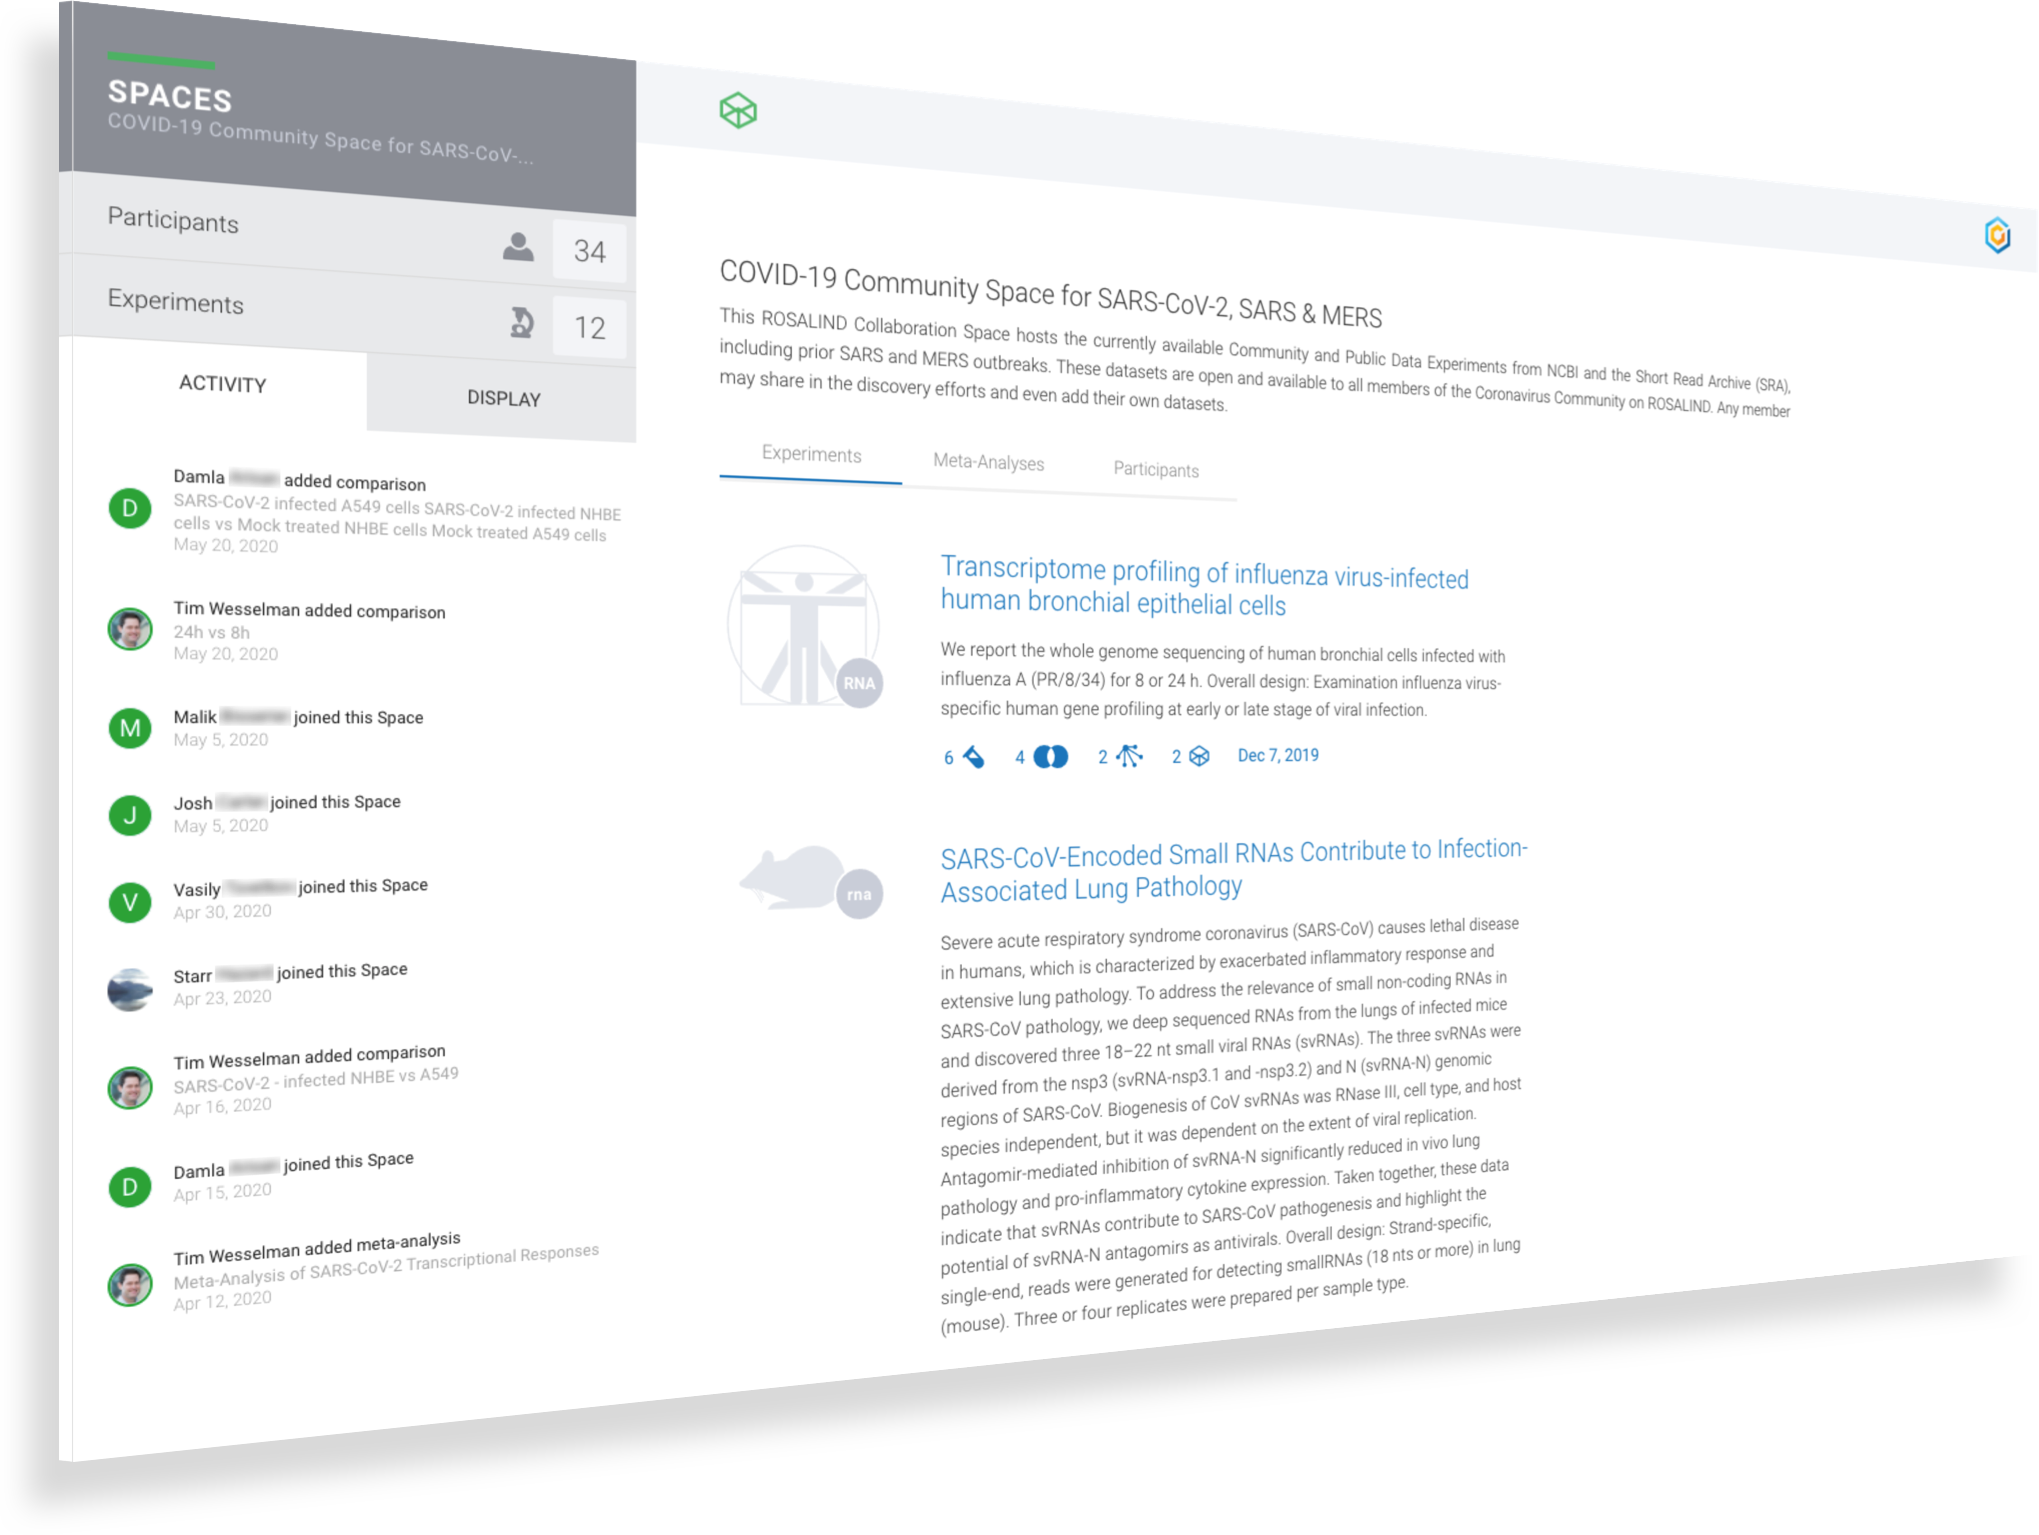
Collaborate on single cell analysis & annotation

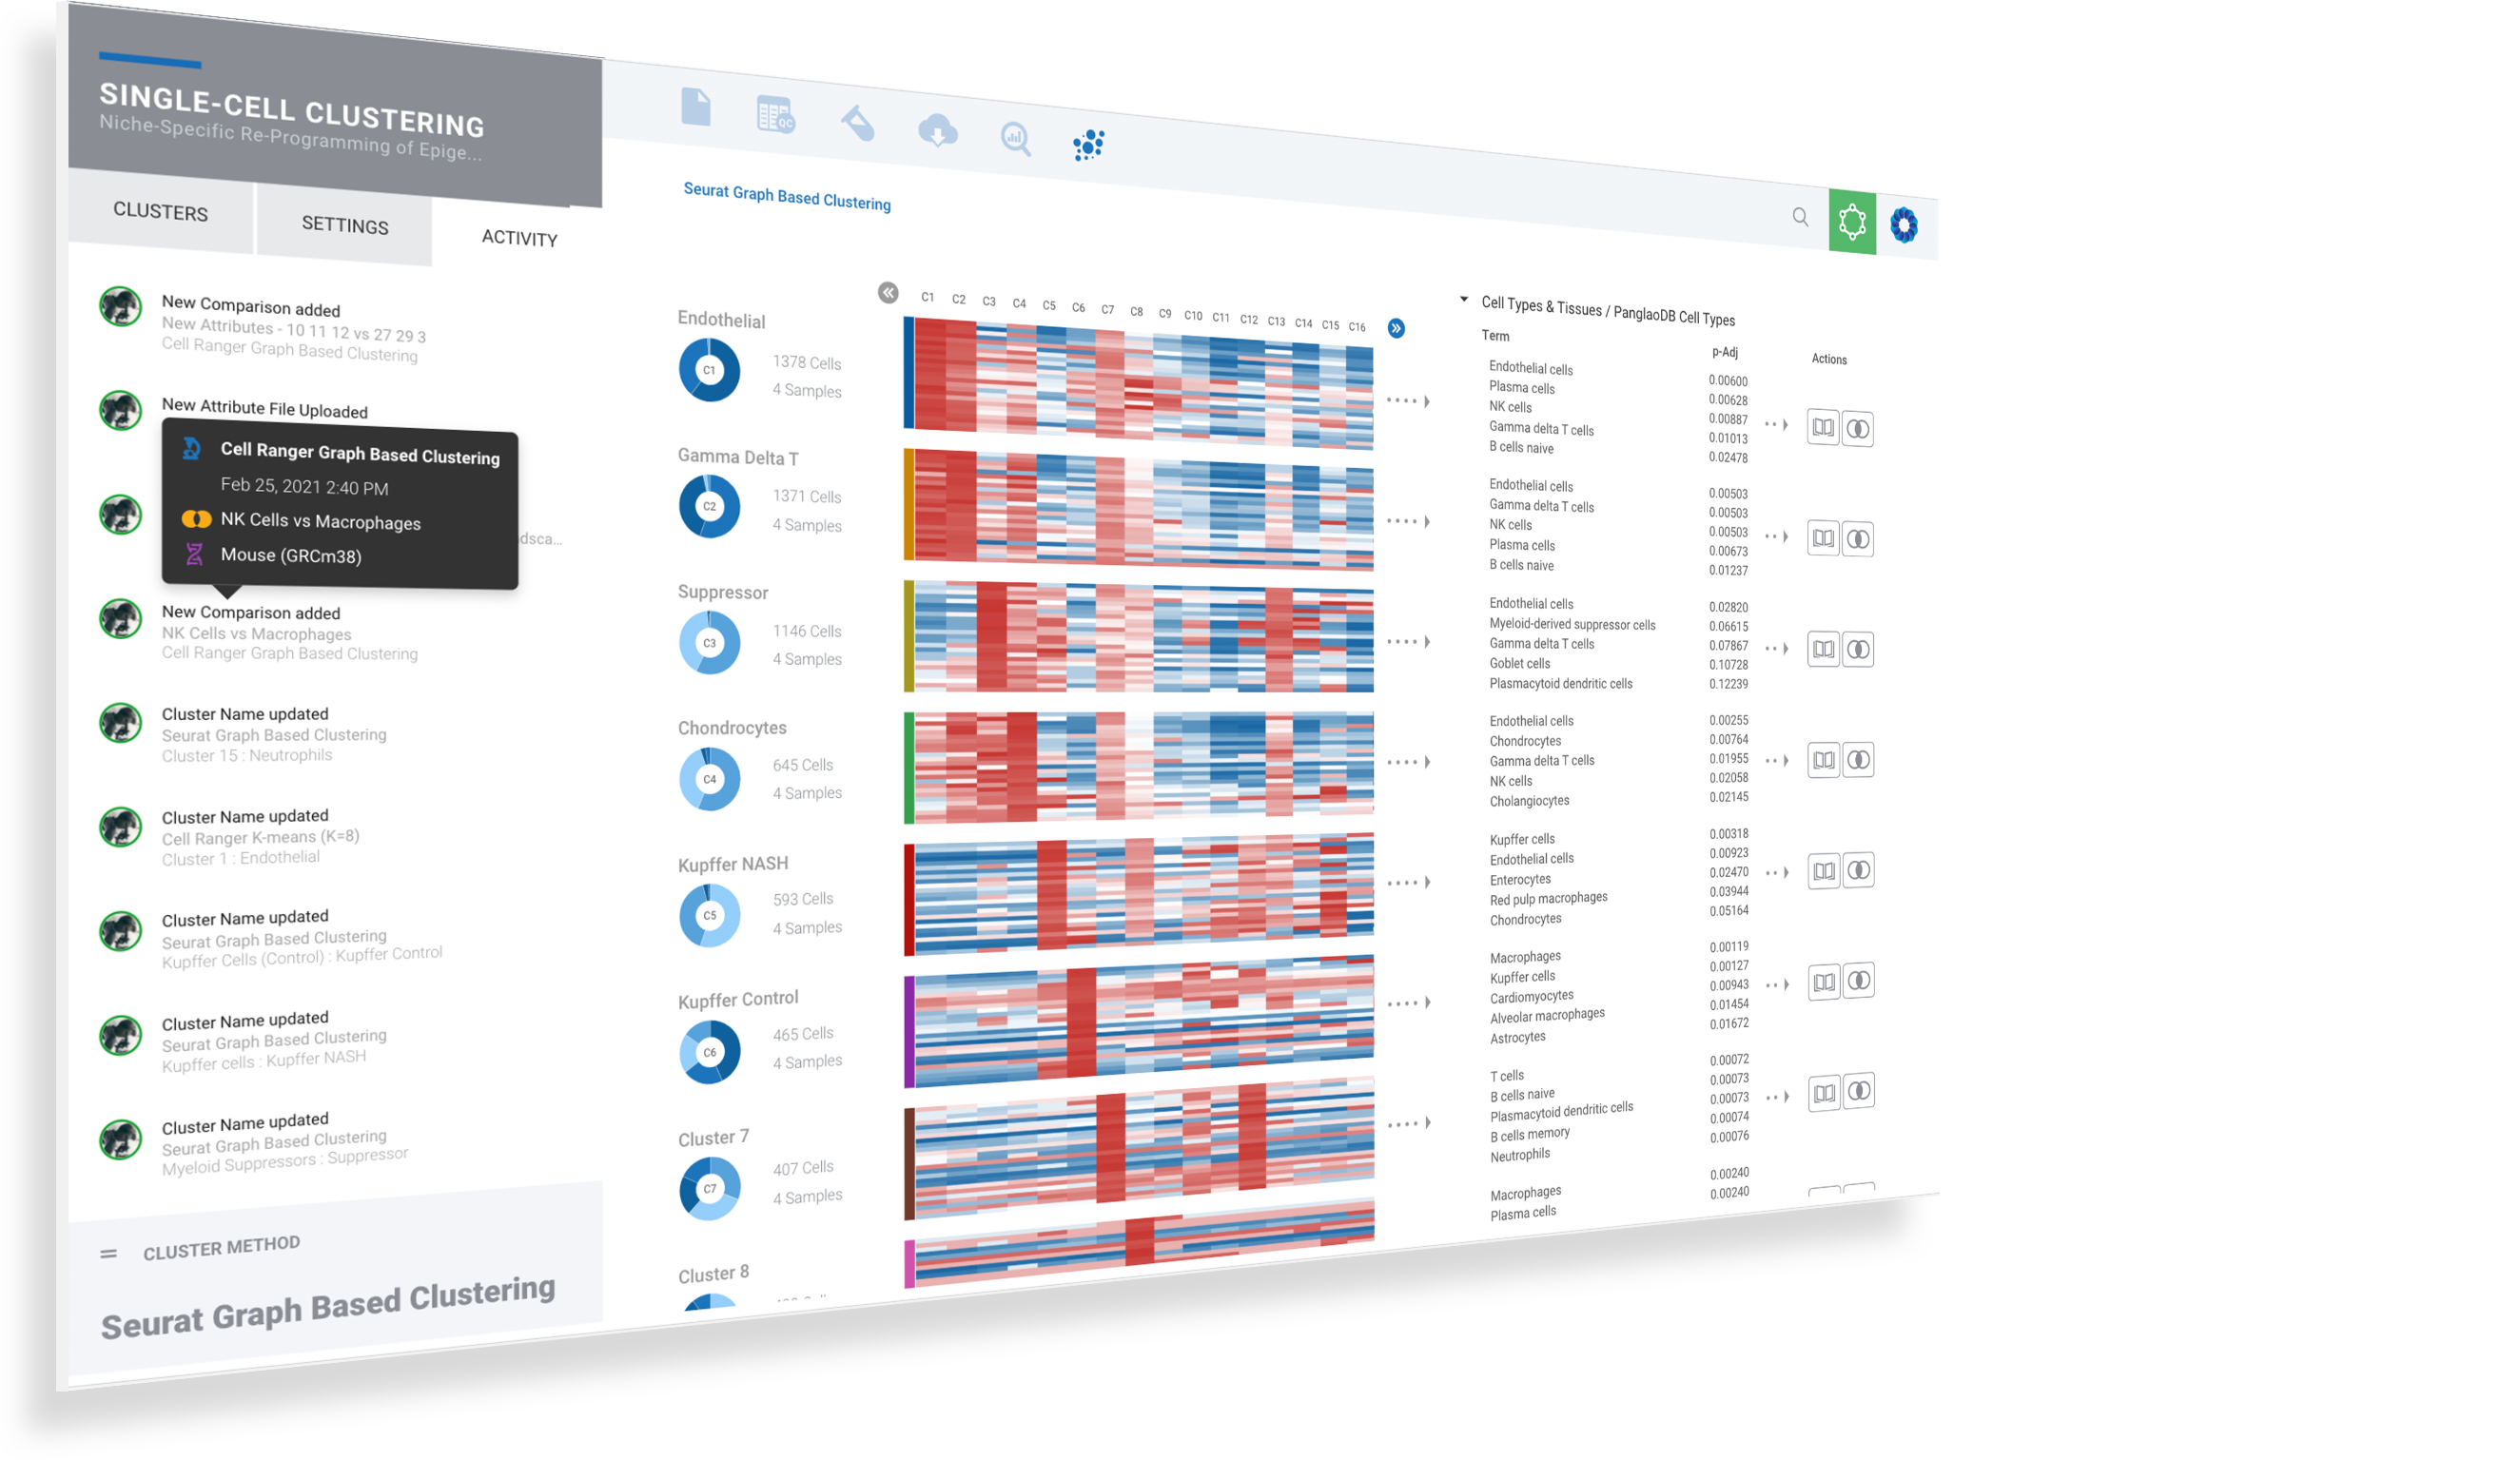
Single cell provides unprecedented data and granularity into biology and challenges our very understanding. Accelerate your single cell interpretation by collaborating in real-time with scientists across the globe.

Interactive activity feeds capture contributions and provide attribution to each team member

See changes to cluster annotation, sample annotation, cluster comparisons, gene cut-offs and more

Check out profile details for your collaborators and teammates

Quickly assess each collaborative contribution by mousing over the activity to see highlights

Instantly navigate to any activity by clicking on the item

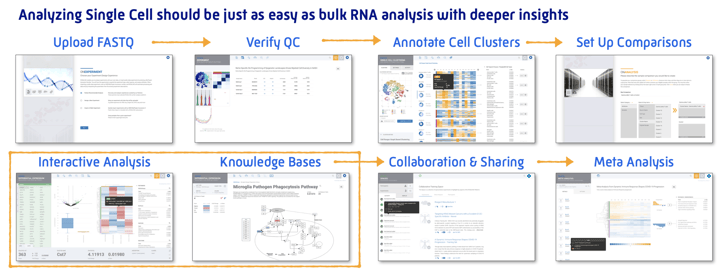
Analyze single cell clusters just as easily as bulk RNA-Seq with the same powerful analysis and even deeper insights

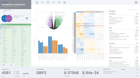
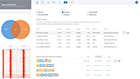
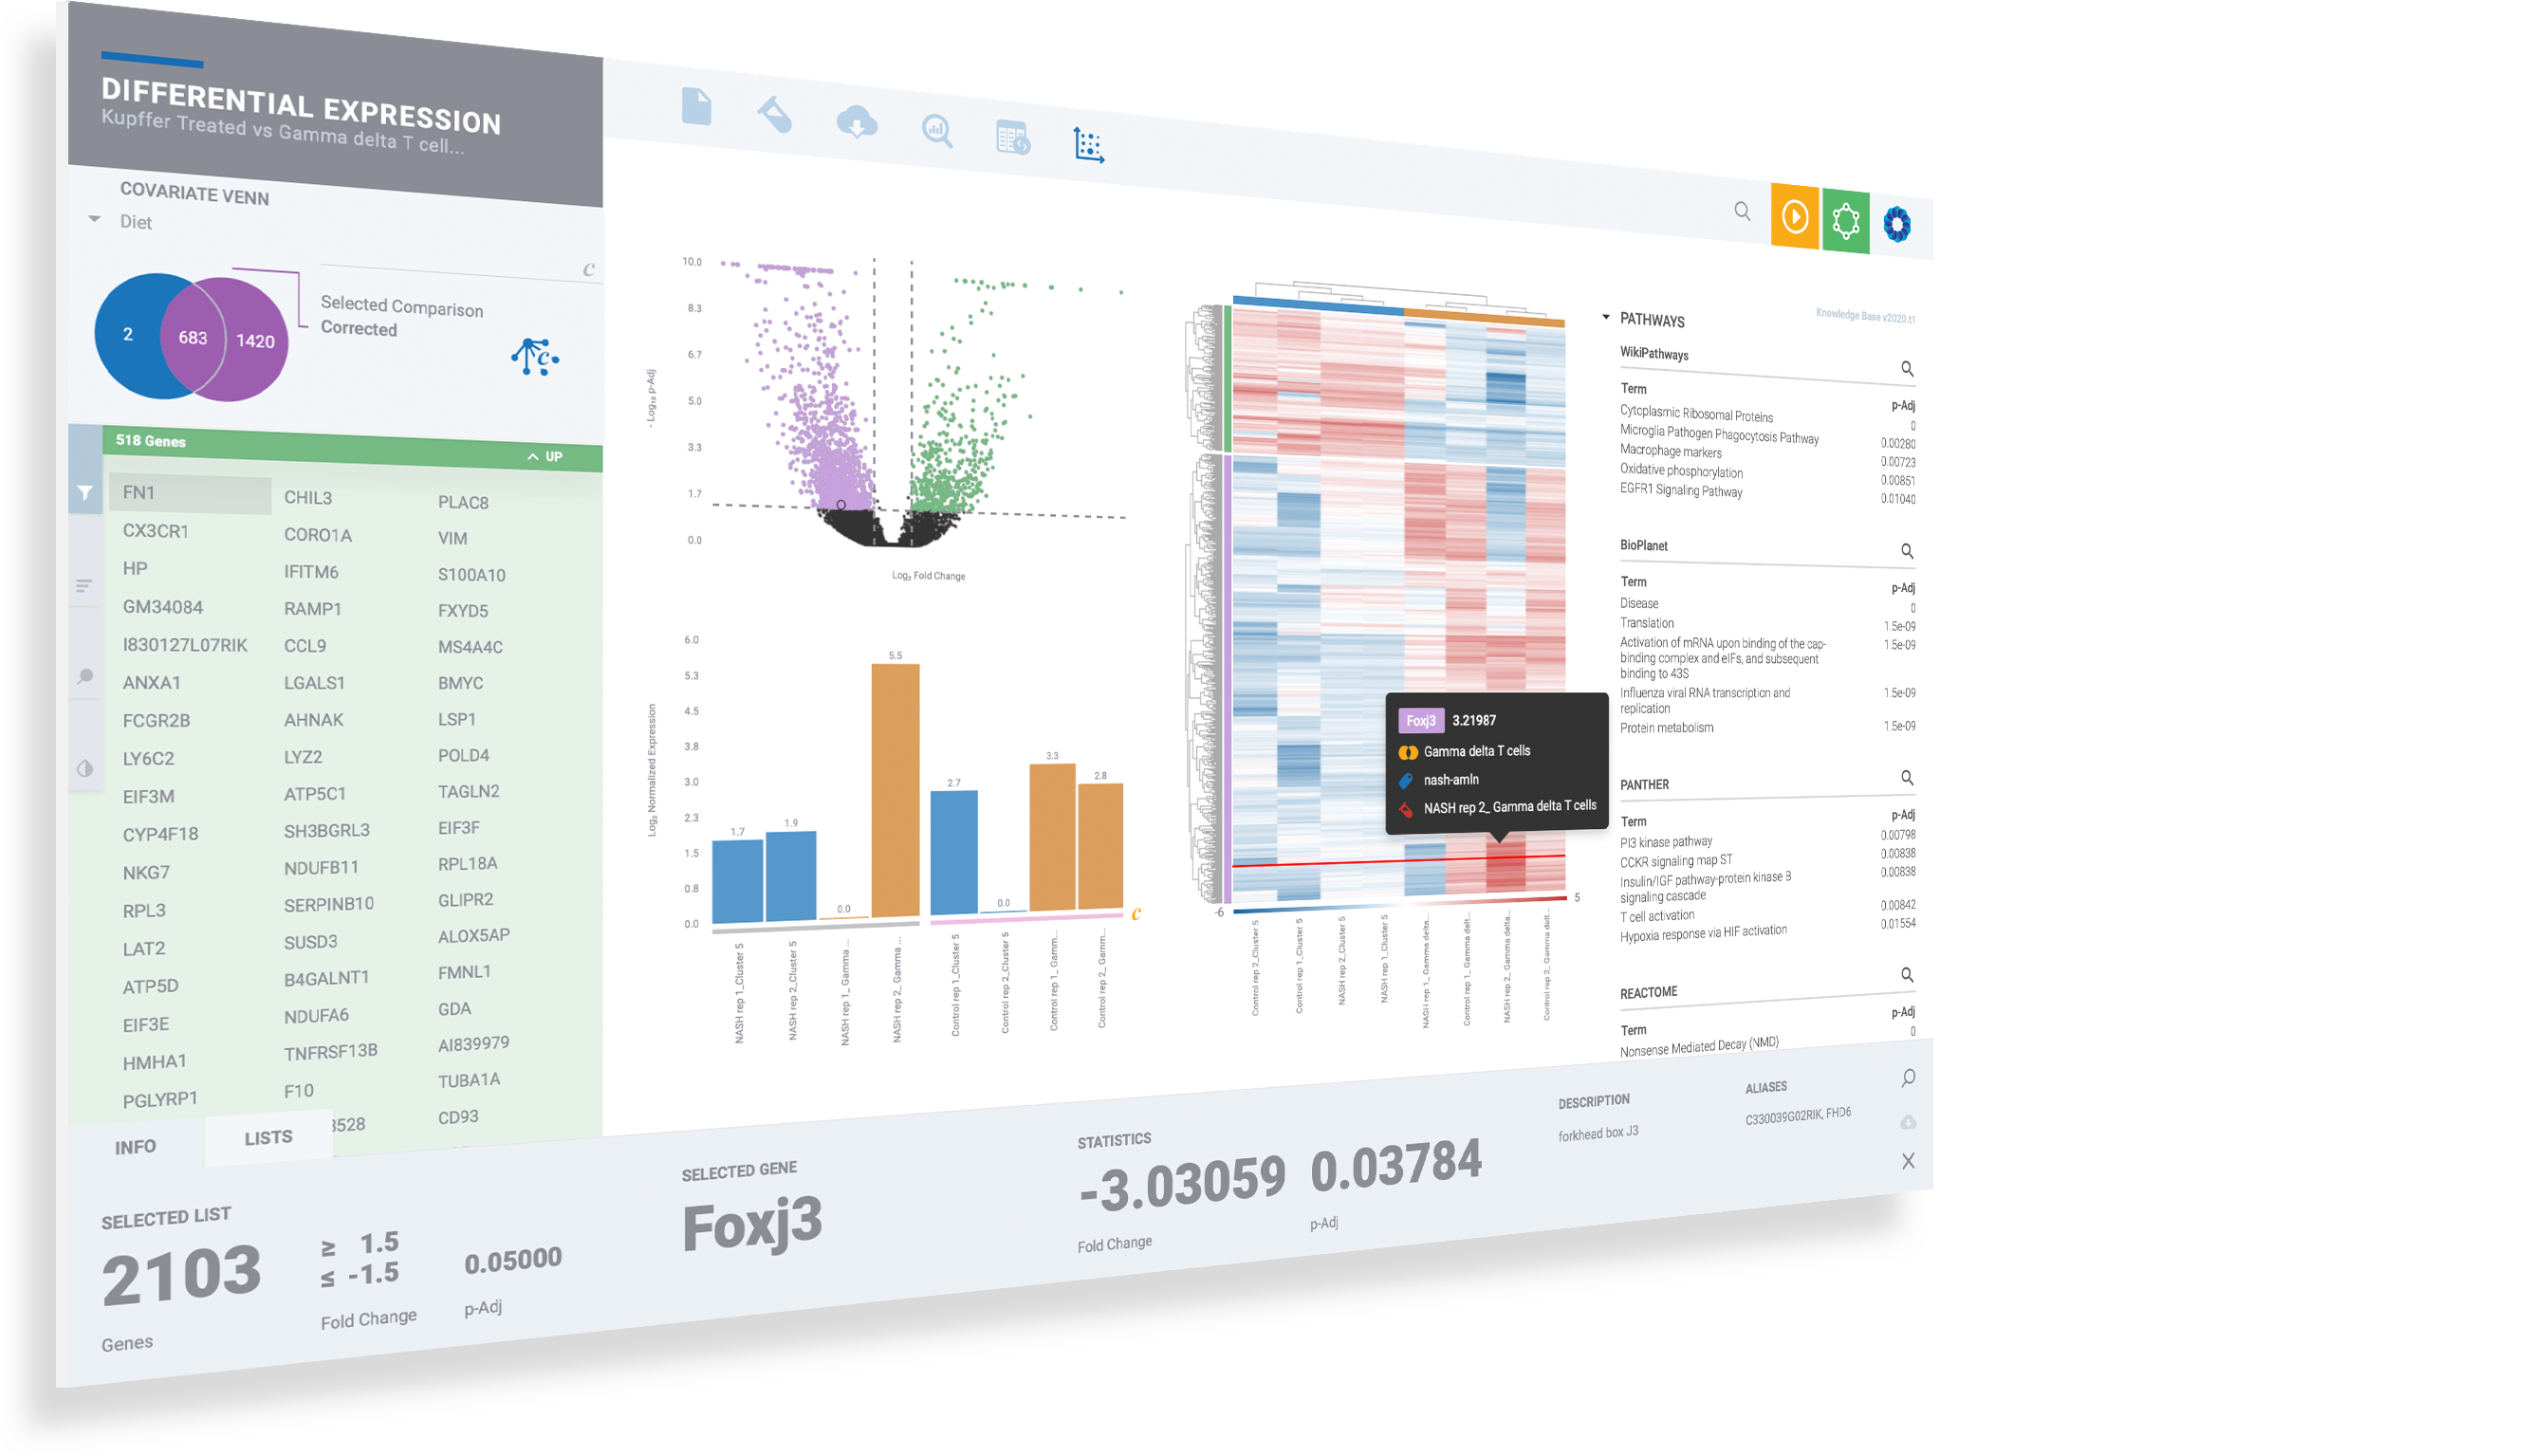
Enjoy the thrill of seeing your differential expression results come to life as dynamic, interconnected plots and diagrams with gene lists, heatmaps, volcano & MA plots, and advanced covariate correction.

Expand the controls on the left to change color schemes, gene sorting and to create new filters and cut-offs

Use the bottom bar to pertinent gene information at your fingertips, including gene list management

Command-click or Control-Click (PC) to multi-select genes and customize plots

Evaluate top pathways and GO terms amongst 50+ knowledge bases by click on terms to instantly evaluate signature expression levels

Click on magnifiers to access additional details

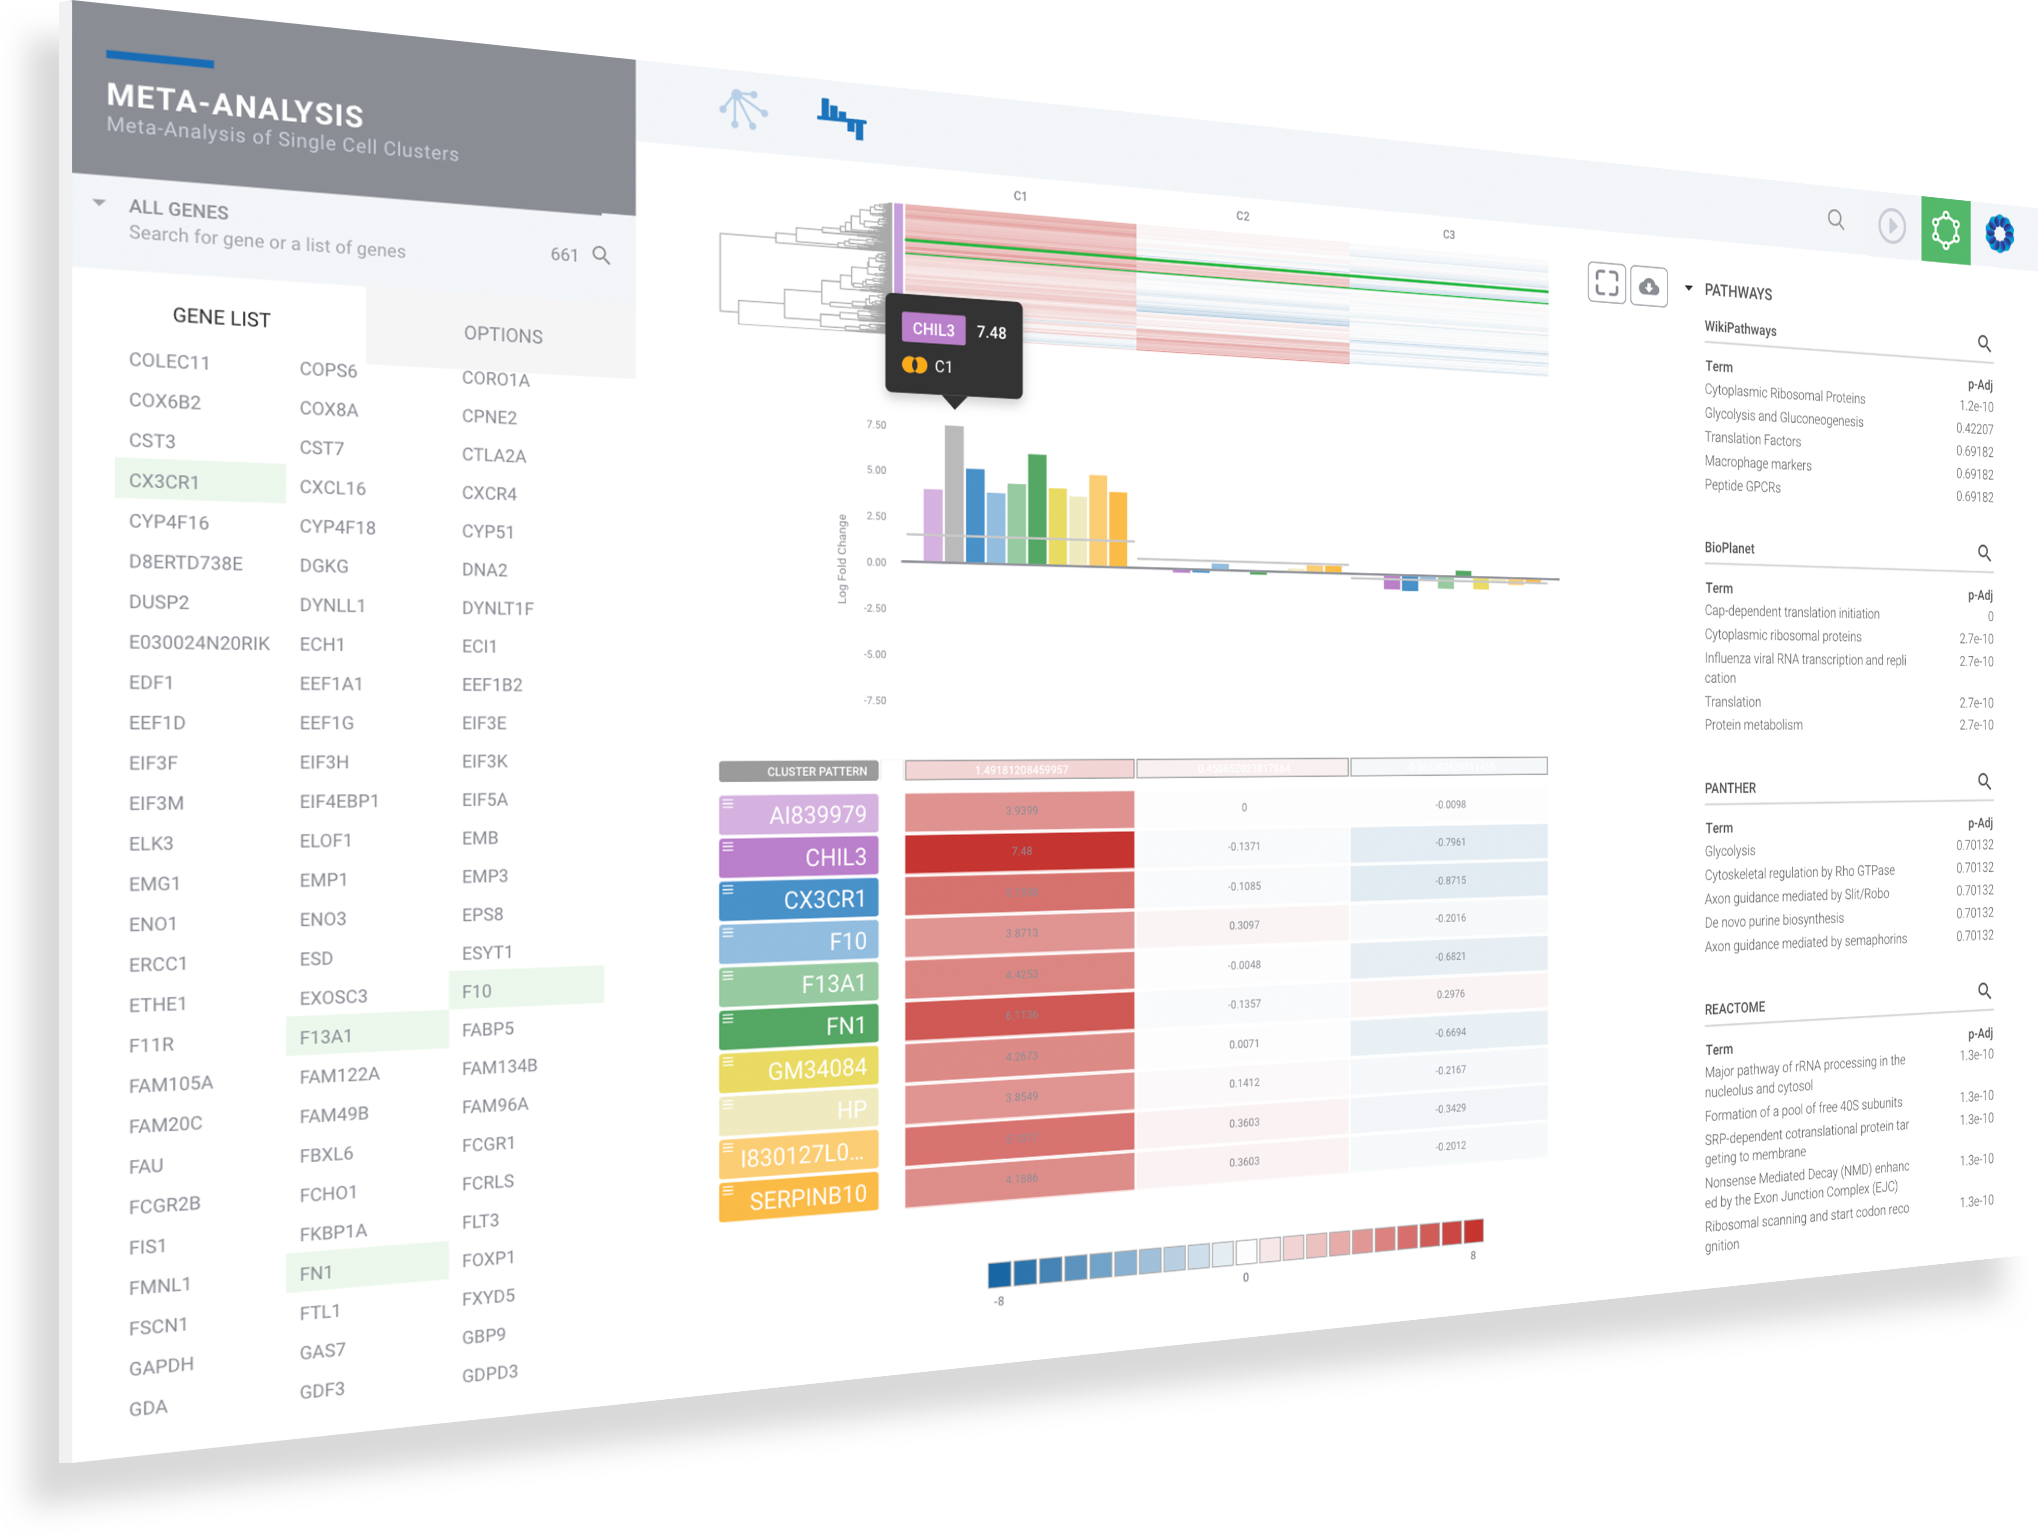
Dive deeper into pathways & the networks connecting them

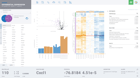
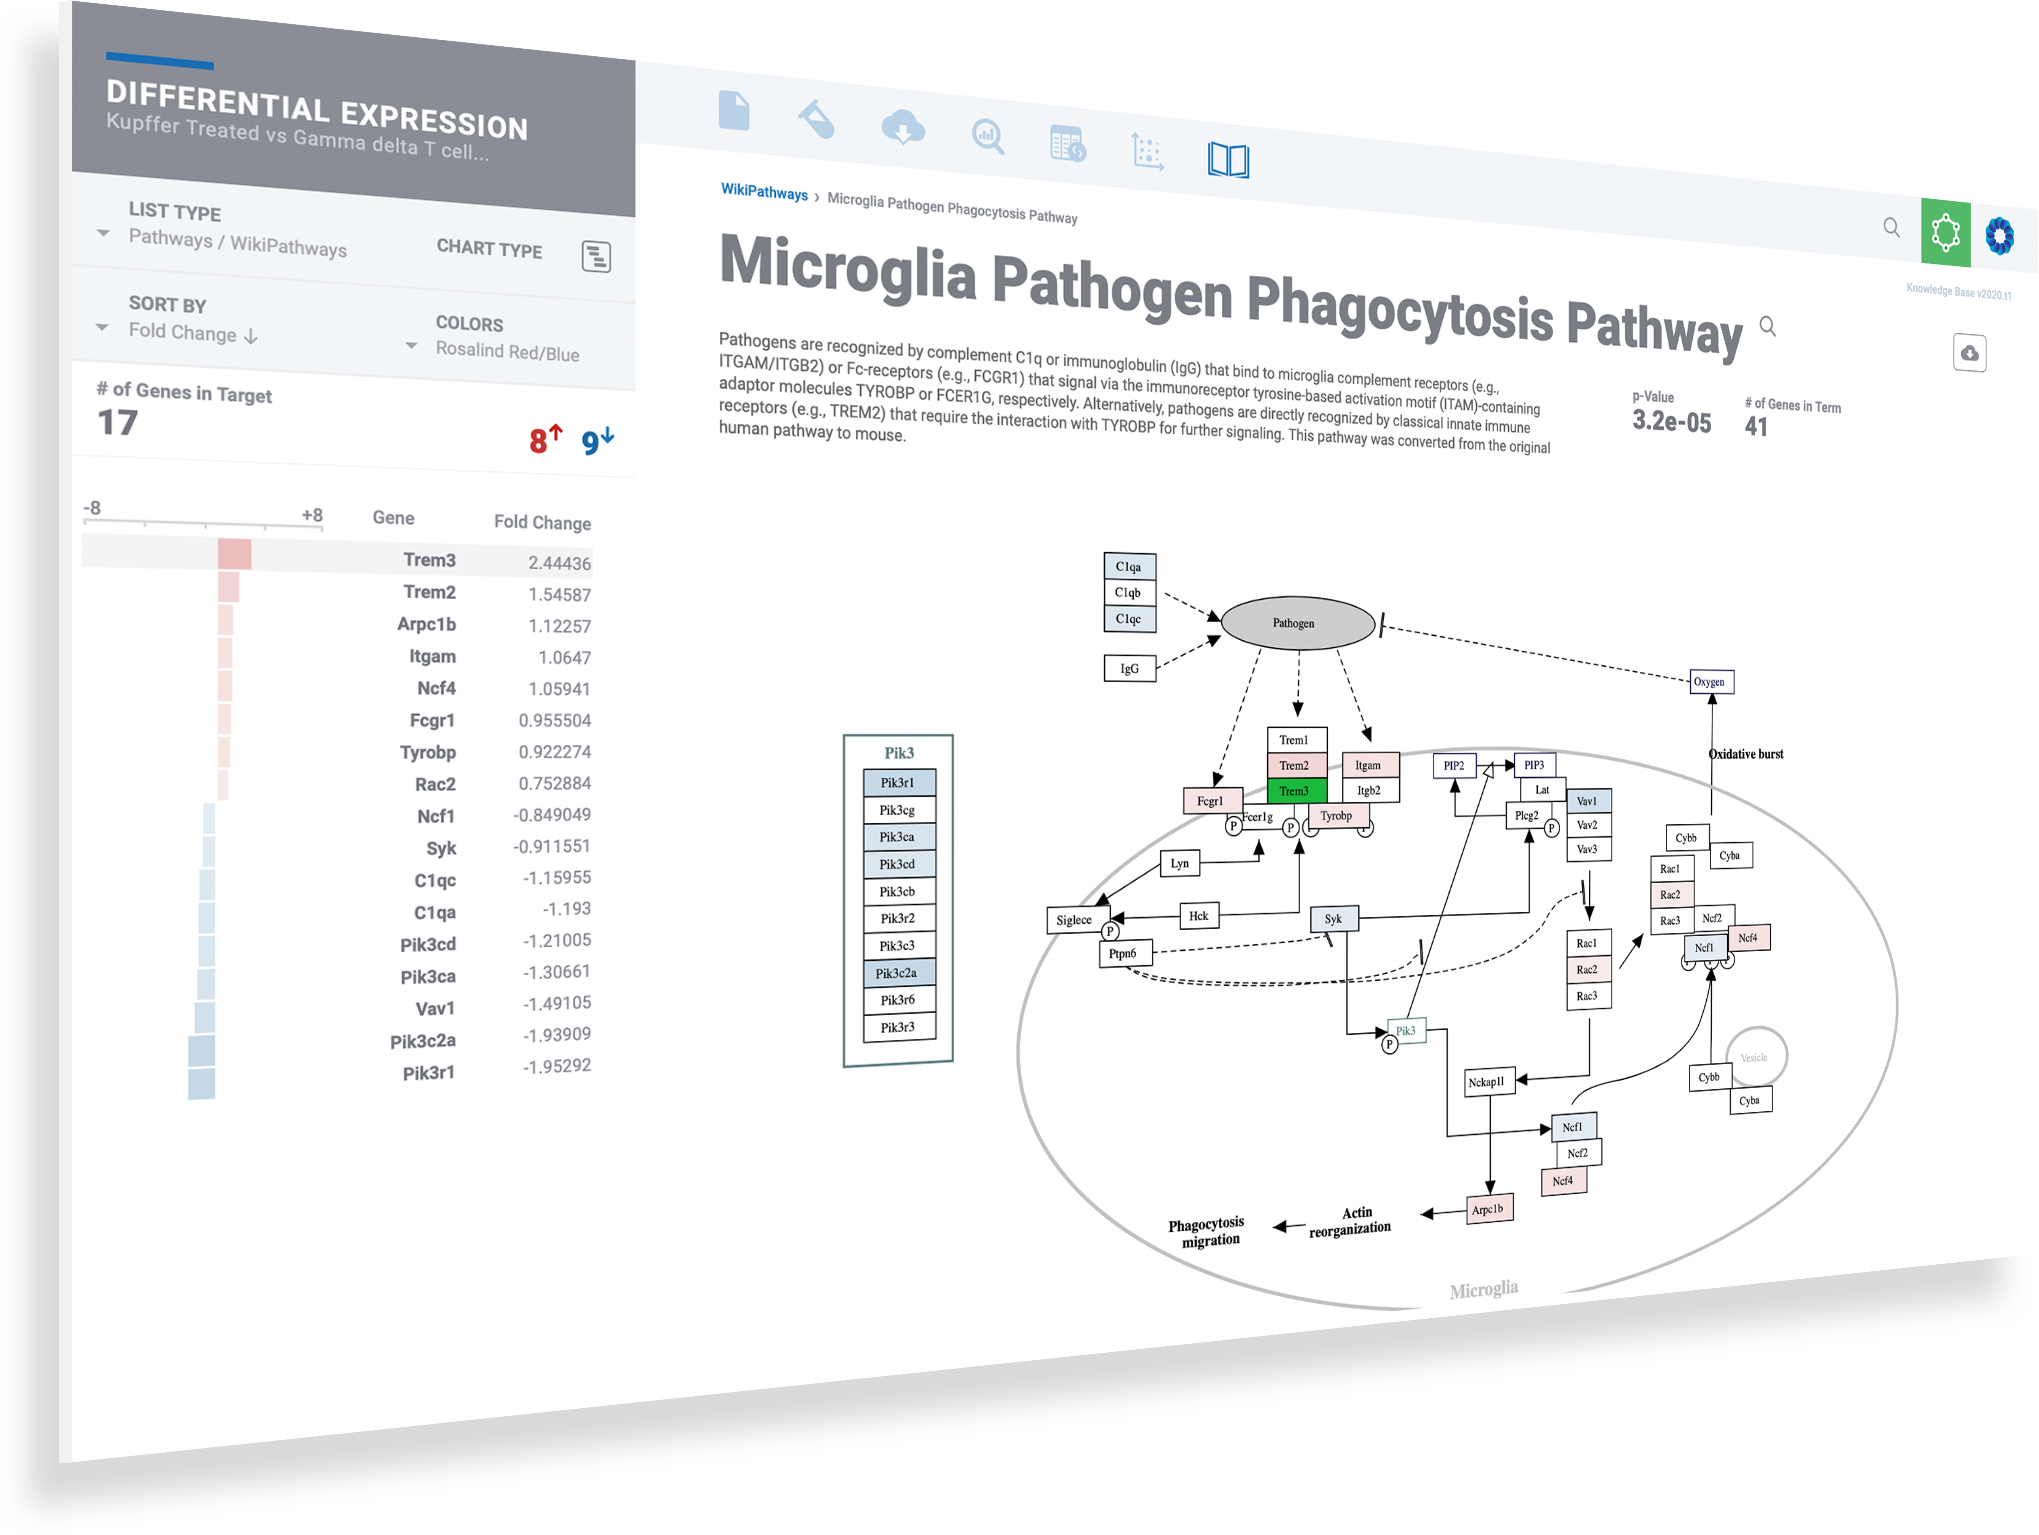
Discover more and save valuable resources through the integrated pathway interpretation provided by the ROSALIND Knowledge Graph and integrated biomedical knowledge bases. Explore interactive pathway diagrams with detailed term descriptions, annotated fold-change colors, and gene heatmaps.

Explore interactive pathway diagrams to evaluate gene expression levels across pathways

Toggle knowledge bases with the list menu on the left

Click the download button to access publication-ready pathway diagrams as well as the associated heatmap and bar plots

Use breadcrumbs in the header to navigate back to prior levels for gene, term and knowledge base resources

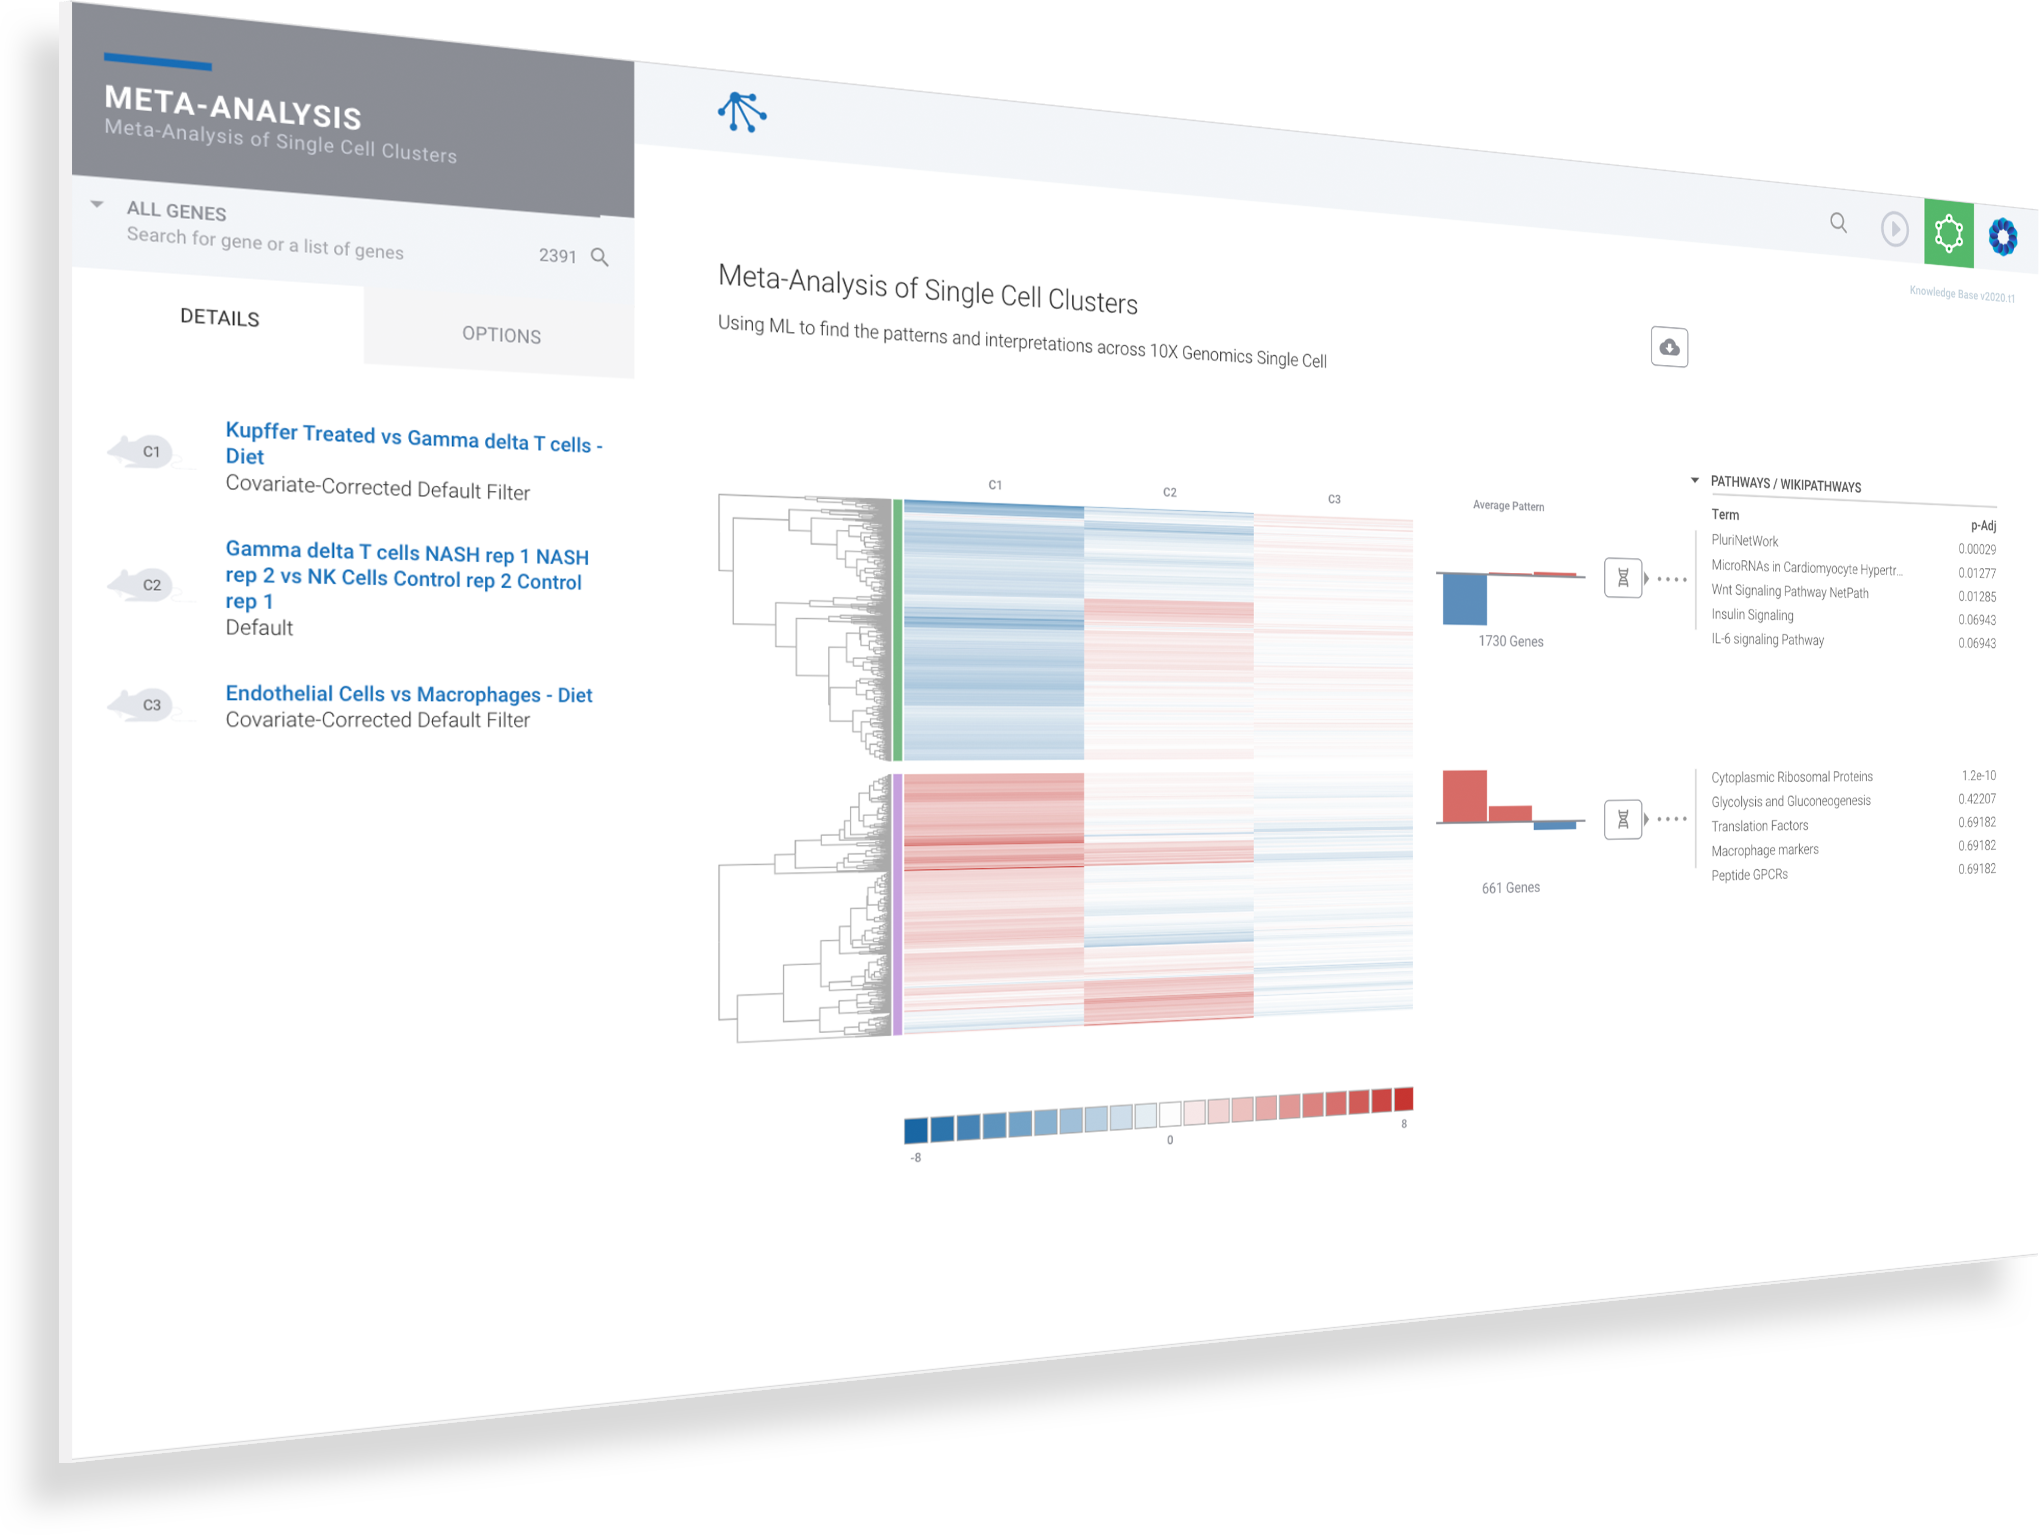
Harness machine learning to analyze single cell clusters across comparisons, experiments and multi-omics datasets

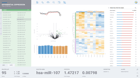
ROSALIND Meta-Analysis combines multi-omics datasets and uses unsupervised machine learning coupled with our advanced Knowledge Graph to intelligently uncover and interpret gene signatures

Single cell experiments are easily compared and contrasted with RNA-Seq, NanoString, ATAC-Seq and ChIP-Seq experiments

Up to 50 multi-omics datasets may be merged in a single meta-analysis

Navigate to and explore underlying experiment details by clicking on the comparison

Navigate to meta-analysis details to access advanced interpretation tools by clicking on the genome icon for the desired siganture

PAUSE PLAY SKIP
Cluster Summary
Marker Genes
Gene Expression
Download Plots
Collaborative Discovery
Cluster Comparisons
Explore Pathways
Meta-Analysis
SLIDE SLIDE SLIDE SLIDE SLIDE SLIDE SLIDE SLIDE SLIDE
View More

How to Analyze Single Cell Expression with ROSALIND

Empowering Scientists with End-to-End Single Cell Interpretation

WHY STUDY SINGLE CELL GENE EXPRESSION 


The study of gene expression on a cellular level provides valuable insights for complex cell populations, novel cell types, and the effects of treatments on cellular processes by quantifying the activity of RNA in individual cells within a sample. Scientists working in Oncology, Immunology, Regenerative Medicine, Drug Discovery and other areas of research often conduct experiments between healthy and disease states to identify differentially expressed genes and biological pathways to discover therapeutic targets. Comparisons between these differential patterns reveal unique gene signatures valuable for drug and diagnostic development.


OVERVIEW


ROSALIND is a cloud platform that connects researchers to their data and team members as well as knowledge bases and team members to aid in interpretation. ROSALIND provides intuitive workflows and analysis interfaces for single cell data:


    ·        Experiment design and FASTQ Data Import

    ·        Quality control

    ·        Cluster annotation with assisted cell type identification

    ·        Comparisons between cell clusters or bulk RNASeq data

    ·        Interactive differential expression and pathway exploration

    ·        Seamless collaboration with team members and collaborators


image-4-1


SINGLE CELL ANALYSIS CAPABILITIES


  • Vivid web-based experience for complete data analysis
  • Optimized for 10X Genomics Chromium Single Cell Library Kits
  • Analyze FASTQ files will fully automated processing 

  • Capture experiment design with guided wizard, or attribute file upload (CSV)
  • Intelligent quality control assessment with automated contamination detection
  • Record metadata with NCBI BioSample attributes 
  • Provides Seurat, and K-Means clustering methods
  • Automated gene clustering in differential expression heatmaps
  • Assisted cell type identification based on top marker gene expression
  • Setup cluster comparisons using biological attributes
  • Perform covariate & batch corrections
  • Create gene filters to adjust cut-offs
  • Download publication-ready figures
  • Securely store results & raw data files
  • Interpretation with Gene Set Enrichment Analysis (GSEA) & Gene Set Variation Analysis (GSVA)
  • Explore pathways, cell types, gene ontology, diseases & drugs with 50+ integrated knowledge bases
  • Multi-omic analyses across experiment & assay types
  • Real-time collaboration & results sharing

“ROSALIND has given us the freedom to analyze and explore our data so we’re not dependent or waiting on anyone else.”

Nicole Coufal

Nicole Coufal
Assistant Professor & Pediatric Intensivist

University of California, San Diego and Rady Children’s Hospital

FIVE STEPS TO SUCCESS WITH SINGLE CELL DATA ANALYSIS


ROSALIND simplifies data analysis and works like a data hub interconnecting every stage of data interpretation. The ROSALIND Single Cell Gene Expression discovery experience enables visual exploration and self-investigation of experiment results to give researchers the freedom to annotate clusters, visualize cell type arrangements, adjust cut-offs, add comparisons, apply covariate corrections, and even find patterns across multiple datasets, without the need for bioinformatic expertise. There are five easy steps to performing Single Cell RNA-seq data analysis on ROSALIND.


1. EXPERIMENT DESIGN

Starting an Single Cell RNA-seq data analysis begins with creating a new experiment and capturing the experiment design. ROSALIND walks through the key aspects of an experiment in a guided experience to record biological objectives, sample attributes and analysis parameters. These details become the basis of the experiment discovery dashboard. Researchers who publish papers and work with NCBI public data know the importance of natively supporting NCBI data models. ROSALIND fully supports the NCBI BioProject and BioSample models for metadata assignment and sample attribute descriptions. ROSALIND also enables scientists to create custom attributes to describe biological behaviors in terms relevant to the experiment. Setup of comparisons is simplified by describing and annotating samples using these familiar terms. This methodology minimizes the risk of differential expression errors when selecting samples for comparison.

When analyzing raw FASTQ files, ROSALIND streamlines data analysis using an advanced pipeline for analysis that includes intelligent quality control with automatic contamination detection, identification of differentially expressed cluster markers, and deep pathway interpretation. Visit the technical specifications section to learn more about the ROSALIND Single Cell RNA-seq data analysis pipeline and available reference materials.

For Single Cell RNA-seq data analysis, an analysis pipeline must adjust for sample preparation and proprietary differences in library preparation kits used in the experiment. Not only is the kit selection important for targeting and capturing the desired transcriptomic elements, the analysis pipeline adjusts and optimizes for the kit’s unique characteristics, such as the presence of unique molecular identifiers (UMIs).

ROSALIND integrates and supports a broad library of sample and library preparation kits, automatically calibrating each analysis with the appropriate details. To learn more about supported kits, visit the technical specifications section. Featured kits and instrument partners are also listed below.


2. SINGLE CELL RNA-SEQ QUALITY CONTROL

Researchers must be confident in the quality control phase before gathering insights from a Single Cell RNA-seq experiment, otherwise, the results of the analysis should not be trusted. Biology’s mysteries are elusive and complex. Time should not be lost chasing corrective measures for outliers, contamination, swapped samples, and the many other errors that can occur in the course of a well-designed experiment.

Some of the most important Quality Control metrics to verify are Q30 scores, alignment rates, ribosomal content, duplicate rates, sample correlation, gene coverage, and multidimensional scaling (MDS) or principal component analysis (PCA) for all samples. When ROSALIND detects low alignment, non-aligning reads are evaluated for possible contamination. Additional information on the number of cells, average reads per cell, and median reads per cell are available to ensure the success of Single Cell experiments.

ROSALIND Quality Control Intelligence identifies potential data quality issues and triages the data before presenting the results. This eliminates the needs for researchers to be experts in Sequencing quality control issues. Researchers can eliminate offending samples and the deleterious effects on results by identifying the sample as an outlier and move confidently into the discovery and exploration phase of results interpretation.


3. UNLOCKING RESULTS

After a researcher has reviewed the quality control phase the interactive presentation of results is ready to begin. The next step is to unlock the experiment. ROSALIND calculates the quantity of Analysis Units (“AU”) required to unlock the results. For Single Cell RNA-seq Experiments, this is generally 2 AU per sample, however, this may differ based on experiment parameters. Single Cell Clustering Analysis results are unlocked at no additional cost. Account balances and quick links for acquiring more AU are directly accessible from the unlock screen. To learn more about Analysis Units, check out the Q&A in the section below, or visit the ROSALIND Store.


4. ANALYSIS & DISCOVERY

ROSALIND allows the identification and characterization of mixed cell populations through a Single Cell discovery experience complete with cluster proportion comparisons between samples, interactive non-linear dimensional reduction plots, (T-SNE/UMAP), identification of differentially expressed cluster biomarkers, and automated cell type classification. Researchers may annotate clusters from multiple clustering methods to discover new patterns within their samples and easily set up comparisons between multiple cell clusters within or across samples.

ROSALIND moves beyond the typical CSV file of differentially expressed genes by providing a comprehensive dashboard for differential expression analysis and interpretation of RNA-seq data. Convenient on-screen controls are easily accessible for visualizing clusters, modifying filters, adding covariant corrections, applying gene lists and signatures, and adjusting plot color palettes. The ROSALIND gene expression discovery experience features deep interpretation of top pathways, gene ontology diseases and drug interactions, as rich interactive plots that fill the screen and respond to interactions from the scientist, showing customizable heatmaps, volcano and MA plots as well as box and bar plots.

New comparisons and meta-analysis may be added at any time. Meta-analyses created can be cross experiments and multi-omic. Each of these perspectives are available within minutes of setup, reducing internal bioinformatic workload and enabling scientists to react fluidly by focusing directly on the science of the experiment.


5. COLLABORATION & DATA SHARING

The discovery process rarely ends with a single point of view from a single researcher’s opinion. ROSALIND Spaces enables true scientist-to-scientist collaboration through virtual data rooms where scientists and collaborators can come together on related datasets anywhere in the world to interactively explore shared experiments much like working with Google Docs. Researchers access a consistent version of the data, without the need to transfer unwieldy files or reinterpret origin files. All changes are interactive, instantly available, and viewable everywhere in the world (as authorized by the organization) with real-time activity feeds and historical reports. Spaces participants can add experiments, explore pathways, change cut-offs, add meta-analyses and add new comparisons all within the shared collaborative environment.

Spaces are virtual meeting rooms where scientists meet with niche experts, clients, and supporting teams to maximize the discovery value of every experiment and prepare for the next one.

HIGHLIGHTS

DESIGNED FOR SCIENTISTS

Designed for the Scientist, so you can focus on the biology without having to wait months, or learn bioinformatics & command-line programming

POWERFUL SCALE

Analyzes thousands of single cells in parallel utilizing massively scalable cloud-computing 

EASE OF USE

Utilizing a clean, intuitive and immersive user interface, Scientists new to the platform ramp quickly with little training to focus on discovery

INTELLIGENT ANNOTATION

Graph-accelerated knowledge bases identify cell types and assist users in annotating cell clusters

CLUSTER COMPARISONS

Compare cell clusters across samples, experiments and multi-omic datasets to reveal deeper biological understanding.

RICH DATA VISUALIZATION

Explore experiment results in high-quality, publiction-ready, interactive diagrams and plots

PATHWAY INTERPRETATION

ROSALIND is designed for the Scientist, so you can focus on the biology and science without having to invest months and months trying to learn bioinformatics, programming or biostatistics

TRUSTED PIPELINES BUILT-IN

Built-in pipelines are tuned to utilize industry standard, widely published bioinformatics tools. For more information, review the ROSALIND specifications and method section

BUILT FOR TEAM SCIENCE

Easily share & collaborate across team members with secure, permissions-controlled spaces

SECURITY AND ENCRYPTION

Every communication and data transfer on ROSALIND is encrypted and secured. Multiple layers of data protection ensure availability

FREQUENTLY ASKED QUESTIONS


faqPerson cube2b

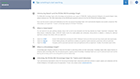
I am not a bioinformatician. Can I really perform my own analysis?

faqROSALIND

Absolutely, and other scientists just like you run their own analyses on ROSALIND every day. To learn more on how to get started, check out the ROSALIND Quick Start Guide here.

faqPerson cube2b

What types of Single Cell experiments are supported?

faqROSALIND

The ROSALIND Single Cell discovery experience currently supports RNA-seq Gene Expression experiments.

faqPerson cube2b

Can I import custom cluster annotations?

faqROSALIND

Yes. Custom Clusters can be imported into ROSALIND from 10X Genomics Loupe Cell Browser, Seurat, or other clustering programs.

faqPerson cube2b

What types of input files are supported?

faqROSALIND

For Single Cell Gene Expression experiments, FASTQ files are supported. Compressed FASTQs will have faster upload time. Supported file types: .FASTQ, .FASTQ.GZ

faqPerson cube2b

What is an Analysis Unit and how is it used on ROSALIND?

faqROSALIND

Samples that are processed on ROSALIND require Analysis Units to unlock the ROSALIND discovery experience. Analysis Units may be purchased in packs of 10 or 50 from the ROSALIND Store. Analysis Units do not expire. A current subscription is required to utilize Analysis Units. Enterprise Subscriptions provide additional flexibility for high-volume environments. Please contact sales to learn more sales@onramp.bio

faqPerson cube2b

What is considered a Sample?

faqROSALIND

Any sample that is prepared for processing on an instrument is considered a Sample for ROSALIND. If a Scientist takes two (2) aliquots of an original sample to have replicates and prepares a library for each, this would be considered two (2) Samples on ROSALIND. On the other hand, a Sample may have multiple files associated with it, depending on how sequencing is performed. A single sample may be single-end, paired-end, and also multi-lane and will still be considered as one (1) Sample.

faqPerson cube2b

Can I download my results and plots?

faqROSALIND

Yes. All plots, diagrams, source and results files are downloadable on ROSALIND. Look for the Download buttons to access publication-ready figures as well as to download all experiment datasets.

faqPerson cube2b

Do you have an API for programmatic interfacing?

faqROSALIND

Yes. We provide API integration for Enterprise customers. This allows production teams to automate the upload, processing, and distribution of genomic datasets. API integration also includes Single-Sign-On (SSO) support.

Accelerating Health Through Research Innovation.

Start Your Free Trial

Receive the free ROSALIND Quick Start Guide with your trial

  • Learn how biologists who need faster results get their work done
  • Easy step-by-step walkthrough to complete your first experiment in under 5 minutes
  • Invite colleagues to collaborate on your experiment in real-time
quick-start-guide best-of-show
footer-1-1
footer-2
footer-3
footer-4
footer-5
footer-6